
Connecting Plotly Graphs to Dash Components
Learn to create interactive data visualizations by connecting Plotly graphs with Dash components. Master various chart types and enhance user interaction in your Python-based dashboards.

Data Visualization GUIs with Dash and Python
Learn to create interactive data visualization interfaces using Dash and Python, covering dynamic graphs, live updates, sentiment analysis, and app deployment for effective data presentation.

The Future of Crypto - Breaking New Ground in Emerging Markets
Explore cryptocurrency adoption in emerging markets, focusing on Dash's efforts to provide financial solutions for the unbanked and facilitate daily transactions.
Building Data Applications on Databricks in 20 Minutes
Learn to create data apps for non-technical users, enabling data-driven decisions. Explore rapid app development using Python frameworks, data access methods, security, governance, and production deployment on Databricks.
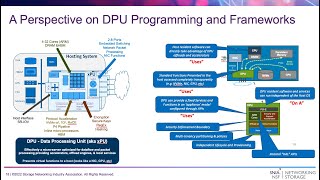
Programming Frameworks for xPU, GPU, and Computational Storage - A Comprehensive Overview
Explore programming frameworks for GPUs, xPUs, and computational storage devices, covering CUDA, SYCL, DOCA, and emerging standards for accelerated processing and host offload capabilities.
Streaming Media with ExoPlayer - Integrating Advanced Video Playback in Android Apps
Learn to integrate ExoPlayer for advanced streaming media in Android apps. Discover its design, features, and customization options for optimal performance and user experience.

ExoPlayer - Flexible Media Playback for Android
Explore ExoPlayer's latest features, key concepts, and customization options for creating exceptional media experiences on Android applications.

GStreamer for Tiny Devices - Optimizing Multimedia Framework for Limited Storage
Learn to optimize GStreamer for small devices, from selecting essential plugins to static compilation techniques, reducing footprint while maintaining functionality for embedded multimedia projects.
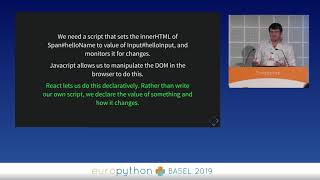
Dash - Interactive Data Visualization Web Apps with No Javascript
Explore interactive data visualization web apps using Dash, a Python framework that eliminates the need for JavaScript. Learn best practices, pitfalls, and when to transition to traditional web development.
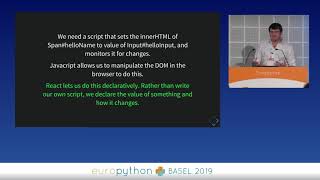
Dash - Interactive Data Visualization Web Apps with No Javascript
Learn to create interactive data visualization web apps using Dash, a Python framework that requires no JavaScript. Discover best practices, common pitfalls, and when to transition to traditional web development.
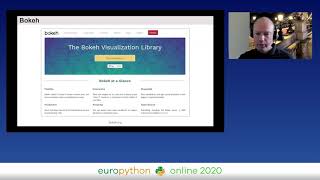
The Python Data Visualization Landscape in 2020
Explore Python's data visualization libraries including Matplotlib, Plotly, Bokeh, and Altair. Learn about dashboarding solutions like Dash, Panel, and Voila, and understand their key features and recent developments.
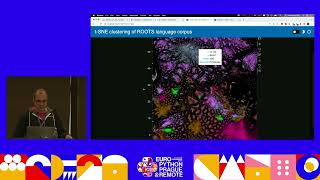
The Needle and the Haystack - Visualizing Single Datapoints Out of Billions
Explore techniques for visualizing and interactively inspecting billions of datapoints using HoloViz ecosystem, overcoming limitations of traditional web-based tools for large datasets.
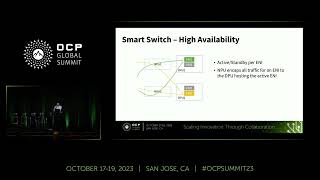
Building Limitless Networks with Smart Switch and SONiC Architecture
Discover how Smart Switch and SONiC integration revolutionizes network scalability and performance through innovative hardware concepts, high availability features, and advanced packet flow management.
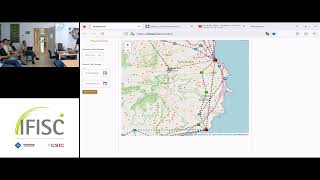
Interactive Visualization Dashboards: Transforming Research Papers into Dynamic Web Applications
Aprende a transformar artículos de investigación en aplicaciones web dinámicas utilizando paneles de visualización interactivos para una presentación más atractiva y accesible de datos científicos.
What's New with rubicon-ml? Capital One's Solution for Logging the ML Lifecycle
Explore rubicon-ml, Capital One's open-source solution for standardizing ML lifecycle logging. Learn to integrate it with popular libraries for efficient model development, monitoring, and governance.