Deep Dive - Prometheus
Explore Prometheus with maintainers in an open Q&A session. Dive deep into its inner workings, features, and future developments. Get expert insights on monitoring, storage, security, and performance optimization.

Using Kubernetes for Handling Second Screen Experience of European TV Show
Explore how Kubernetes and GoLang power a scalable second-screen experience for a popular Danish TV bingo show, handling 100x load increases during live broadcasts.
Observability for Air Conditioners - An IoT Story with Talos
Explore how Prometheus and observability tools are applied to IoT devices like air conditioners, addressing challenges and opportunities in real-world data monitoring beyond traditional Kubernetes environments.

Observability with Consul Connect
Explore setting up and observing a service mesh platform using Consul Connect, focusing on effective monitoring through metrics, logs, and traces with Prometheus, Loki, Tempo, and Grafana.

Prometheus – What it is, What is New, and What is Coming
Explore Prometheus: its origins, recent developments, and future roadmap. Learn about this powerful metrics-based monitoring system and its impact on the cloud-native ecosystem.

Making Prometheus Even More Open
Explore efforts to enhance Prometheus' openness, including export toolkit, remote write receiver, exemplars, UI updates, and community initiatives for increased transparency and collaboration.
Leveraging Prometheus' TSDB for Conprof - Continuous Profiling
Explore conprof, an open-source tool for continuous profiling. Learn how it adapts Prometheus' time-series database for efficient storage and analysis of CPU and memory profiles over time.

Auto-suggesting and Generating Recording Rules for Prometheus
Discover techniques for auto-suggesting and generating Prometheus recording rules to optimize high-cardinality metrics, improve query performance, and prevent timeouts in alerts and dashboards.

Automating Kubernetes Rollouts with Argo and Prometheus for HA
Explore advanced Kubernetes deployment strategies using Argo Rollouts and Prometheus monitoring for efficient, automated, and highly reliable application upgrades with minimal downtime.

PromQL Compatibility Testing - Verifying Vendor Claims for End User Benefit
Explore PromQL compatibility testing to verify vendor claims, ensure ecosystem consistency, and prevent lock-in. Learn about an open-source compliance suite and real-world implementation comparisons.

A New Kid in Histogram Town
Explore the evolution of histograms in Prometheus monitoring, focusing on the new sparse high-resolution design and its implementation progress for improved data visualization and analysis.
Go for DevOps, Go for Microservices, and What Go Is
Explore Go's role in DevOps and microservices, its strengths and limitations, and the reasons behind its success in these domains.

Getting Started with Observability Lab - Opentracing, Prometheus, and Jaeger
Hands-on lab exploring observability tools for cloud-native applications. Install and use Prometheus, Grafana, and Jaeger to monitor Kubernetes clusters and instrument microservices for improved troubleshooting and diagnostics.
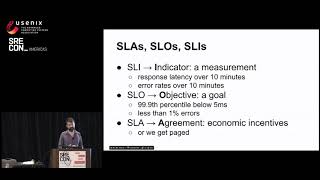
A Practical Guide to Monitoring and Alerting with Time Series at Scale
Explore time series-based alerting methods and practical examples in Prometheus to reduce alert spam and improve production hygiene for more efficient monitoring at scale.
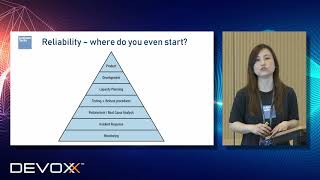
Site Reliability Engineering & Distributed Services Design
Explore SRE principles and building blocks for transforming applications with observability, security, and scalability using open standards like gRPC, Envoy, and Prometheus in enterprise environments.
Istio, We Have a Problem! Understanding and Fixing Bugs with a Service Mesh
Explore Istio service mesh for debugging, monitoring, and deploying microservices. Learn to use Service Graph, Prometheus, Grafana, and traffic mirroring for effective problem-solving and blue-green deployment.

Infrastructure and Application Monitoring Using Prometheus
Learn to monitor container-based environments and host systems using Prometheus, Docker, Consul, and Grafana. Create health dashboards and set alerts for optimal infrastructure performance.
Observability in the MLOps Lifecycle with Prometheus
Explore MLOps monitoring with Prometheus, covering ML deployment challenges, data drift, and model metrics. Learn to enhance existing systems and integrate with tools like Flyte, Seldon Core, and FastAPI.

How Prometheus Revolutionized Monitoring at SoundCloud
Explore how Prometheus transformed SoundCloud's monitoring, addressing challenges in microservices architecture and offering insights into its implementation, features, and impact on system observability.
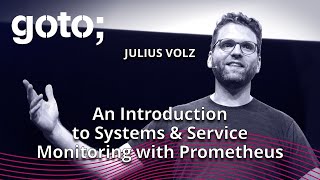
An Introduction to Systems and Service Monitoring with Prometheus
Explore systems monitoring with Prometheus, covering its architecture, data model, querying, and alerting features for efficient cloud-based environment management.

SLO Burn - Reducing Alert Fatigue and Maintenance Cost in Systems of Any Size
Discover strategies to reduce alert fatigue and maintenance costs in systems of any size using Service Level Objectives (SLOs) and symptom-based alerting with Prometheus.