Into the Deep Waters of API Machinery
Explore Kubernetes API intricacies: namespace deletion issues, REST mapping challenges, and garbage collection mechanisms. Gain insights into common problems and their solutions.
The Cloud Native Journey at Adobe
Explore Adobe's cloud-native journey: migrating enterprise products to Kubernetes, implementing DevOps, and leveraging tools like Envoy, Helm, and Prometheus for improved automation and visibility.

Serverless 2.0 - Get Started with the PLONK Stack
Discover the PLONK stack for Cloud Native Applications, combining Prometheus, Linkerd2, OpenFaaS, NATS, and Kubernetes to create a complete PaaS/FaaS solution, reducing friction for developers working with Kubernetes.

All Your Telemetry Data from Any Source in One Place
Learn to centralize telemetry data using OpenTelemetry standards and New Relic's platform. Hands-on labs cover data ingestion, visualization, and custom dashboard creation for efficient monitoring and issue resolution.
Micrometer - New Insights into Your Spring Boot Application
Explore Micrometer, a powerful instrumentation library for JVM applications, and learn how to collect, publish, and visualize metrics in Spring Boot 2.0 for enhanced application insights.
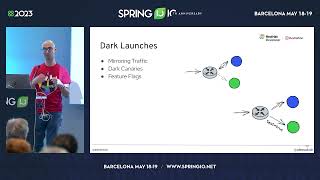
Progressive Delivery in the Kubernetes Era
Explore progressive delivery techniques for Kubernetes, including blue-green deployments, canary releases, and service mesh, to validate applications in production environments safely and efficiently.

Prometheus - For Both Big and Little People
Explore Prometheus monitoring for small and large deployments, covering data collection, service discovery, alerting, storage, and visualization with Grafana.
Faucet SDN Tutorial
Hands-on tutorial for installing and configuring Faucet SDN controller, exploring features like VLANs, ACLs, and routing. Includes network monitoring with Prometheus and Grafana dashboards.

Performance Testing of Prometheus Based Metric Platforms
Discover how Hootsuite evaluated Prometheus and Grafana metrics platforms using load testing, and learn about their Locust-based framework for assessing performance impacts of configuration changes.
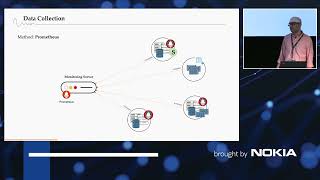
Model Stochastic Behavior of Failures in Telco or IT Systems
Explore stochastic failure modeling in telco/IT systems using Machine Learning. Learn data collection, neural networks, and practical implementation for improved system reliability.
Custom Metrics with Pushgateway, Prometheus and Grafana
Explore custom metrics implementation using Pushgateway, Prometheus, and Grafana for effective monitoring and visualization of system performance and data analysis.

Get Instrumented!
Learn to instrument Python apps with Prometheus for real-time insights. Explore metrics collection, dashboards, and monitoring to improve application performance and system understanding.
Is Sharing GPU to Multiple Containers Feasible?
Explore GPU sharing for ML workloads in Kubernetes, maximizing utilization and cost-efficiency. Learn to extend Nvidia device plugin for multi-workload scheduling on a single GPU.
Prometheus Introduction
Comprehensive introduction to Prometheus, an open-source monitoring system and time series database, covering its architecture, key features, and suitability for cloud environments.

Migrating Transactions Worth Billions of $ to Service Mesh With No Downtime
Discover how Gopay migrated billions in transactions to a service mesh architecture with zero downtime. Learn key decisions, migration strategies, and monitoring techniques using Prometheus and Cortex.
Introduction to Contour - A High Performance Multitenant Ingress Controller for Kubernetes
Explore Contour, a high-performance ingress controller for Kubernetes. Learn its features, roadmap, and advantages over alternatives, including integration with Envoy and service APIs.
Weaving a Mesh for Multiple Clusters at bol.com
Discover how bol.com implemented a service mesh for resilient connectivity across multiple Kubernetes clusters, optimizing costs and enhancing uniformity in cloud and on-premises environments.
ComponentConfig Technical Challenges
Explore ComponentConfig's technical challenges, including strict decoding, instance-specific configs, and hierarchical components. Learn how to contribute and make an impact on these critical Kubernetes issues.
Deep Dive into Cloud Provider for Azure
Explore Azure cloud provider implementation, recent updates, and new capabilities for Kubernetes. Learn about development environments and how to contribute to the project.
Better Histograms for Prometheus
Explore advanced histogram techniques for Prometheus, addressing limitations and proposing efficient high-resolution solutions for improved metrics processing and analysis.
Thanos - Cheap, Simple and Scalable Prometheus
Explore Thanos, an open-source project extending Prometheus for global-scale, highly available monitoring. Learn basic concepts, use cases, and deployment on Kubernetes for unlimited metric retention at low cost.