Complete DevOps Project: Deploy GoLang App with Kubernetes, ArgoCD, Prometheus and Grafana
Deploy a secure GoLang app with Kubernetes, ArgoCD, Prometheus & Grafana. Learn modern DevOps practices for automated, secure, and scalable deployment pipelines using various tools and technologies.
OpenMetrics, OpenTracing, OpenTelemetry - Are We There Yet?
Explore observability standards for distributed systems: OpenMetrics, OpenTracing, and OpenTelemetry. Learn to instrument systems for logs, metrics, and traces, with a focus on C# and .NET Core examples.

Monitoring, Logging, and Security in DevOps
Implement monitoring, logging, and security in DevOps with hands-on exercises using Prometheus, Grafana, and CI/CD pipeline security measures.
Master Prometheus on Kubernetes - Spotting Every Issue Without Alert Fatigue
Optimize Prometheus on Kubernetes: Implement best practices for effective alerting, reduce noise, and leverage key components to detect critical issues in large-scale environments.
Unlocking Cost Savings and New Possibilities: Your Guide to Prometheus Remote Write 2.0
Discover how Prometheus Remote Write 2.0 enhances metric storage capabilities while reducing egress costs by up to 60%, featuring improved functionality and backward compatibility for cloud-native monitoring systems.
Towards Zero Change Incidents: Intuit's Strategy for Implementing AI-Driven Progressive Delivery
Discover how Intuit achieves zero-incident deployments through AI-driven progressive delivery, using ML models and Prometheus monitoring to automatically detect and prevent deployment-related issues.
Introduction to Cortex - Multi-Tenant Scalable Prometheus Architecture
Discover how Cortex enables scalable, multi-tenant Prometheus monitoring with long-term storage capabilities, exploring its architecture, features, and production implementation strategies.
From Chaos to Calm - Building a Unified and Scalable CI/CD Pipeline
Discover how to build a unified CI/CD pipeline using cloud-native tools like Argo Rollouts and Backstage, improving development efficiency and reducing operational workload by 40% through streamlined workflows.
Supercharge Your Kubernetes Autoscaling with Custom Metrics
Master Kubernetes Horizontal Pod Autoscaler (HPA) configuration using custom metrics beyond CPU and memory. Learn to implement dynamic scaling based on business-specific indicators like queue depth and throughput.
OpenTelemetry Hands-on - Automatic and Manual Instrumentation for Java and Python Applications
Master OpenTelemetry implementation with hands-on exercises in Java and Python applications, covering instrumentation, data collection, and analysis using Jaeger and Prometheus for enhanced observability.
Enabling Intelligent Observability Volume Management
Discover how to intelligently manage observability data volume in edge cloud environments using the Observability Volume Manager framework for optimized monitoring and cost control.
Mastering Kubernetes Operators with KubeBuilder - Sending Metrics to Prometheus
Learn to build Kubernetes operators using KubeBuilder, integrate with Prometheus for monitoring, and implement custom metrics for enhanced observability of your containerized applications.
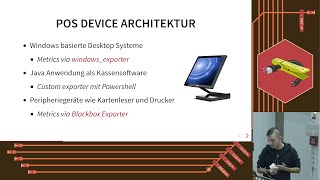
Dokumentationsgetriebenes Monitoring mit Netbox und Prometheus
Entdecke, wie die Integration von Netbox und Prometheus automatisiertes Monitoring ermöglicht und Dokumentation von einer lästigen Pflicht zu einem wertvollen Asset verwandelt.
From Observability to Performance in Kubernetes - Metrics, Analysis, and Optimization
Discover how to optimize Kubernetes service performance through effective metrics collection, analysis, and bottleneck identification using tools like Prometheus, Grafana, and kube-burner for enhanced user experience.
Operationalizing High-Performance GPU Clusters in Kubernetes - Lessons Learned from Training Databricks DBRX
Dive into advanced strategies for managing large-scale GPU clusters in Kubernetes, focusing on monitoring, health detection, and solving complex failure scenarios in LLM training environments.

Tame MTTR with Real-Time Anomaly Detection in Cloud-Native Systems
Master real-time anomaly detection techniques for Kubernetes clusters using statistical and ML algorithms to reduce MTTR, improve monitoring, and maintain optimal application performance.
Fluent Bit - Building Better Pipelines for Observability and Telemetry Data Management
Discover how to build scalable data pipelines with Fluent Bit for efficient telemetry data collection, processing, and integration with Prometheus and OpenTelemetry formats.