Chat with Me and Get the PromQL You Want
使用LLMs开发的聊天机器人将自然语言转换为PromQL查询,简化Prometheus监控系统操作,为SRE和开发人员提供准确高效的替代方案,无需阅读文档或查询指标含义。
Connecting Thanos to the Outer Rim via Query API
Explore Thanos' new Query API feature for connecting to managed Prometheus solutions, enabling global querying across diverse data sources and unlocking innovative use cases in cloud-native monitoring.
How and Why We Rebuilt Auto-scaling in OpenFaaS with Prometheus
Explore the rebuild of OpenFaaS auto-scaling using Prometheus, featuring improved metrics, PromQL samples, and live demos. Learn about challenges faced and solutions implemented for better performance.
Envoy Metrics Demystified - Hands-on Workshop
Hands-on workshop exploring Envoy proxy metrics for application insights. Learn about topology, connection metrics, PromQL basics, and create Grafana dashboards through practical scenarios with HTTP and gRPC endpoints.
How Prometheus Indexes Data and Why You Should Care
Dive into Prometheus data indexing, exploring on-disk layout and data structures. Gain insights on managing cardinality and optimizing PromQL queries for better performance.
Alerting and Anomaly Detection - Best Friends Forever?
Explore the relationship between alerting and anomaly detection in monitoring systems, discussing their strengths, limitations, and optimal integration for effective system management.
Distributing PromQL for Fast and Efficient Kubernetes Fleet Monitoring
Explore techniques for optimizing Prometheus query performance in large-scale Kubernetes environments, focusing on query pushdown and sharding to enhance read path efficiency and data processing.
Prometheus: Introduction and Deep Dive - From Basics to New Features
Comprehensive overview of Prometheus monitoring system, covering architecture, data model, querying, alerting, and recent feature updates for efficient cloud-native observability.
DoorDash's Journey from StatsD to Prometheus - Scaling to 10 Million Metrics per Second
Explore DoorDash's migration from StatsD to Prometheus, handling 10 million metrics/second. Learn best practices, challenges, and lessons for efficient large-scale metric management.

Do We Still Need to Observe? The Future of AI and Observability
Explore how AI revolutionizes observability practices, from automated query writing and dashboard creation to enhanced root cause analysis and streamlined alert management in modern tech operations.
Introduction to Prometheus, PromQL, and PromLens
Comprehensive introduction to Prometheus monitoring system, PromQL query language, and PromLens tool. Covers setup, configuration, metrics exploration, querying, and practical application for effective system monitoring.
The Future of AI and Observability - Do We Still Need to "Observe"?
Explore how AI is revolutionizing observability, from automated data analysis to intelligent alerting, and discover the potential for faster, more efficient system monitoring and troubleshooting.
PromQL Compatibility Testing - Verifying Vendor Claims for End User Benefit
Explore PromQL compatibility testing to verify vendor claims, ensure ecosystem consistency, and prevent lock-in. Learn about an open-source compliance suite and real-world implementation comparisons.
Intro - Prometheus
Explore Prometheus with maintainers: design, goals, history, and core concepts. Learn about time series, data structure, exposition format, and PromQL query language for effective production use.
Measure PromQL and MetricsQL Expression Complexity
Explore PromQL/MetricsQL query optimization techniques, including data models, time series analysis, and performance improvement strategies for efficient observability in complex systems.
Crafting and Leveraging Prometheus Metrics for Infrastructure Intelligence
Explore Prometheus metrics for data-driven infrastructure decisions. Learn query-building, tools, and data warehouse concepts to maximize insights from your system's metrics.
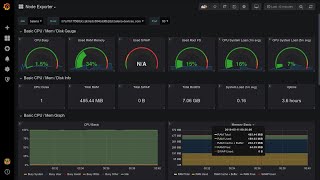
Installing and Configuring Prometheus - A Comprehensive Guide
Install, configure, and leverage Prometheus for effective system monitoring. Master data collection, querying, visualization, and alerting to gain valuable insights into your applications and infrastructure.

Prometheus Certified Associate (PCA) Certification Overview and Demo
Explore Prometheus certification, prepare with resources, and learn to instrument applications for data pushing to Prometheus via pushgateway. Includes demo and comprehensive course overview.