How to Improve Visibility in Kubernetes with Prometheus, Grafana, and NGINX
Enhance Kubernetes monitoring using NGINX, Prometheus, and Grafana. Learn to leverage dashboards, export metrics, and create visualizations for improved visibility and performance tracking in microservices environments.

Kubernetes Monitoring Made Easy with Prometheus
Learn to monitor Kubernetes clusters with Prometheus, covering installation, configuration, metrics, alerts, and best practices for effective cluster management and performance optimization.

DevOps Tutorial for Beginners in Hindi
Great Learning brings you this 10-hour long tutorial on DevOps for Beginners in Hindi to take you from the starting point through the finishing point of everything you need to know about DevOps and getting started on the journey to master it.
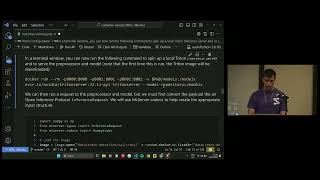
Production ML Serving and Monitoring with Kubernetes
Gain insights into building an MLOps deployment platform using Kubernetes, integrating key technologies for serving and monitoring complex deep learning models.

Dynatrace Extensions 2.0 for Visual Studio Code - Tutorial and Live Demo
Extend Dynatrace's observability capabilities using Extensions 2.0 framework. Learn to develop, test, and manage extensions with the new Visual Studio Code Add-On through a hands-on Apache Kafka example.
OpenObservability Without Boundaries with Dynatrace
Explore OpenObservability with Dynatrace: ingest data from various sources, connect logs, metrics, and traces, analyze with DQL and notebooks, and automate tasks through workflows.
Instrument a Cloud-Native ASP.NET Core Microservice
Hands-on guide to instrumenting cloud-native ASP.NET Core microservices for diagnostics and performance monitoring using Application Insights, Azure Monitor, and Prometheus.

Setup Prometheus Monitoring on Kubernetes Using Helm and Prometheus Operator - Part 1
Learn to deploy Prometheus and Grafana on Kubernetes using Helm and Prometheus Operator. Understand components, access UIs, and gain insights into efficient monitoring setup for your cluster.
Docker Tutorial for Beginners
Comprehensive guide to Docker: containerization, installation, commands, architecture, orchestration, AWS integration, monitoring, and Spring Boot deployment with hands-on demonstrations.

Using NGINX as a Kubernetes Ingress Controller
Learn to implement NGINX as a Kubernetes Ingress Controller for efficient load balancing of HTTP and TCP/UDP applications, including installation, configuration, monitoring, and troubleshooting techniques.
Monitoring and Log Management in K8s with Prometheus, Grafana and Loki - Mirantis Labs Tech Talks
Learn to monitor Kubernetes clusters using Prometheus, Grafana, and Loki. Gain insights into capturing logs and metrics, visualizing data, and correlating metrics with logs for improved observability.
Launching an Automated Cluster with Lens
Learn to launch and manage Kubernetes clusters using Lens IDE. Explore logging, monitoring, and alerting features, and see a live demo of the Lens desktop application for efficient K8s development and operations.
Kubernetes Observability Stack - How to Use TOBS with Linode LKE
Learn to deploy and use TOBS (The Observability Stack) on Linode Kubernetes Engine, exploring key monitoring tools like Prometheus, Grafana, and TimescaleDB for enhanced cluster observability.
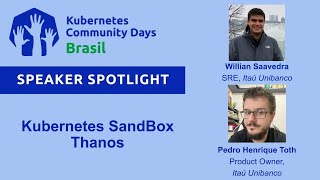
Kubernetes Sandbox: Implementing High Availability Metrics with Thanos
Implementação de plataforma open-source de alta disponibilidade com Prometheus, Kubernetes e Thanos para observabilidade em instituição financeira, incluindo arquitetura e insights.
Is Kepler Accurate on Specific Platforms?
探讨Kepler项目在特定硬件平台上的准确性,介绍新的平台验证框架,以评估和识别功率建模的准确性和平台限制,实现自动化和平台无关的验证。
Build a High Performance Remote Storage for Prometheus with Unlimited Time Series
高性能Prometheus远程存储方案:支持无限时间序列,将目标标签编码到一列,应用标签展平为独立列,实现高性能查询,解决高基数问题
Prometheus Introduction and Deep Dive
深入探讨Prometheus:从基础介绍到最新功能,了解这个强大的监控系统及其在云原生环境中的应用,并有机会为项目做出贡献。
Multi-Cluster Alerting: A Kubernetes-Native Approach
Unveils a Kubernetes-native solution for multi-cluster and multi-tenant alerting, covering metrics, events, auditing, and logs. Features layered RuleGroups CRDs, custom evaluators, and comprehensive notification management.
Chat with Me and Get the PromQL You Want
使用LLMs开发的聊天机器人将自然语言转换为PromQL查询,简化Prometheus监控系统操作,为SRE和开发人员提供准确高效的替代方案,无需阅读文档或查询指标含义。
Grafana Charm: Introducción y Uso en Español - COS-Lite
Explora Grafana: su funcionalidad, relaciones del charm, implementación y código fuente. Aprende a acceder y utilizar esta herramienta de visualización de datos en el contexto de COS-Lite.
Introducción al Charm de Loki para Kubernetes - COS-Lite (En Español)
Descubre Loki: su funcionamiento, relaciones, métodos de recepción de logs y uso práctico. Explora el código fuente del charm y su integración con otros componentes en Kubernetes.