
Monitoring Tools with Grafana
Explore Grafana's powerful data visualization and monitoring capabilities for effective metric analysis and alerting across diverse data sources.
Применение Grafana Stack для Централизованного Логирования и Трейсинга
Узнайте, как эффективно внедрить Grafana stack для централизованного логирования и трейсинга, включая миграцию с Elastic на Loki и Tempo, масштабирование и решение технических проблем.
Kepler - Powering Up the Efficiency of Your Cluster
Explore Kepler, a Kubernetes-based tool for measuring container energy consumption, enabling sustainable cluster management and optimized energy use through metrics and observability.
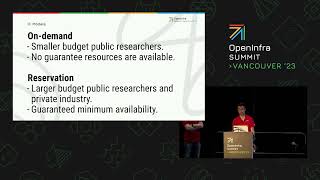
One Nova Cluster to Serve Multiple Computing Needs - Managing On-Demand and Dedicated Instances
Discover how San Diego Supercomputer Center efficiently manages a unified nova cluster serving diverse user needs, from on-demand instances to dedicated hosts, using OpenStack, Ceph, and custom Python solutions.
Enhancing the Performance Testing Process for gRPC Model Inferencing at Scale
Explore performance testing for gRPC model inferencing at scale using Kubernetes, KServe, and ModelMesh. Learn about deployment, load testing, and monitoring key metrics.
Envoy Metrics Demystified - Hands-on Workshop
Hands-on workshop exploring Envoy proxy metrics for application insights. Learn about topology, connection metrics, PromQL basics, and create Grafana dashboards through practical scenarios with HTTP and gRPC endpoints.
Enable Serverless Metrics in Apache OpenWhisk on Kubernetes with Prometheus
Learn to enable serverless metrics in Apache OpenWhisk on Kubernetes using Prometheus. Explore system and user metrics, understand OpenWhisk's structure, and see a live demo of metric collection and visualization.
Service Mesh Without the Mess - Implementing Cilium Service Mesh with eBPF
Explore service mesh implementation using Cilium and eBPF, covering monitoring, tracing, and performance optimization for distributed systems like Kubernetes.

Introduction to Timescale - Getting Started with Time-Series Data
Comprehensive introduction to TimescaleDB, covering setup, data import, querying, and advanced geospatial time series analysis with hands-on demonstrations and expert insights.
Distributed Load Testing with k6
Explore k6, an open-source load testing tool. Learn to create scenarios, set checks, define thresholds, and visualize metrics. Discover how to scale tests across multiple nodes for distributed load testing.
Transition to Apache Kafka on Kubernetes With Strimzi
Learn how Maersk migrated from Confluent to self-managed Apache Kafka on Kubernetes using Strimzi, including architecture, implementation, monitoring, and self-service solutions for their Event Streaming Platform.
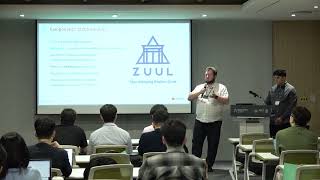
Setting Up CI Environment with Software Factory - A Complete Guide
Discover how Software Factory streamlines development workflows by integrating essential tools like Gerrit, Zuul, and Grafana, enabling efficient code management and monitoring for new projects.
Storing Continuous Benchmarking Data in Prometheus
Explore using Prometheus for benchmarking distributed systems, gaining insights into performance issues through comprehensive metric collection and analysis.
GitOps: A Realistic DevSecOps Scenario with Kubernetes and Flux - Lightning Talk
Explore GitOps implementation on Kubernetes using Flux, featuring realistic DevSecOps scenarios, team collaboration, security measures, and monitoring in a dev-to-prod process.
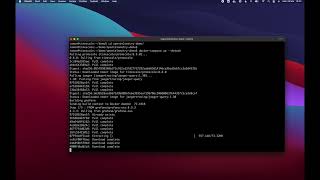
Understanding Your System with OpenTelemetry, Grafana, and Promscale
Explore advanced system monitoring using OpenTelemetry, Grafana, and Promscale. Learn to visualize latency, trace services, and analyze dependencies for enhanced performance insights.
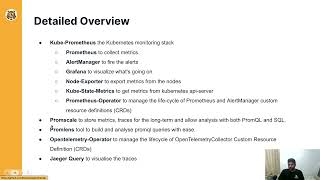
Deploy a Full CNCF-Based Observability Stack in Under 5 Minutes with Tobs
Deploy a full CNCF observability stack quickly with tobs, exploring its components, architecture, and features. Learn about Promscale, dashboards, and monitoring tools for efficient cloud-native observability.
Alerting in the Prometheus Ecosystem - The Past, Present and Future
Explore the evolution of Prometheus Alertmanager, from its modular architecture to improvements in Cortex and Grafana integration. Learn about current developments and future plans for this critical cloud native observability tool.

Prometheus Sparse High-Resolution Histograms in Action
Explore Prometheus sparse high-resolution histograms: instrumentation, ingestion, storage, querying, and visualization. Learn about precise quantile estimations and high-resolution heatmaps with real-world benchmarks.

SIG Scalability in Kubernetes - Introduction and Deep Dive
Explore Kubernetes scalability: definition, measurement, testing infrastructure, performance improvements, and regression prevention. Learn about SIG Scalability's efforts and future roadmap.
Energy Efficient Placement of Edge Workloads
Explore Kepler for container-level energy metrics in Kubernetes, enabling efficient workload placement and sustainable cluster management through integration with observability tools.
Leveraging OpenTelemetry for Your Prometheus Pipeline
Explore OpenTelemetry's integration with Prometheus, covering receivers, exporters, migration paths, and common scenarios for leveraging OTel in your metrics pipeline.