Building Smart Farms with Edge Computing Systems Using Kubernetes
Explore edge computing for smart farms using K3s, sensors, and Raspberry Pi. Learn to design and implement real-time monitoring systems for agriculture in Latin America.
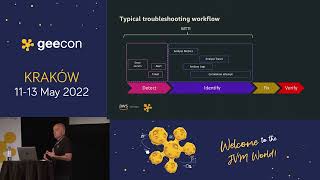
Modern Observability for Cloud Applications - Spectacles on Steroids
Explore modern telemetry for cloud-based distributed systems, covering observability pillars, AWS services, OSS integration, and reference architectures for enhanced monitoring.
Kubernetes Cluster Monitoring with Prometheus, Alertmanager, and Grafana
Explore Kubernetes cluster monitoring, its importance, challenges, and implementation using Prometheus, Alertmanager, and Grafana for enhanced infrastructure workflow.
Observability of Microservices Using Open Source Solutions
Explore open-source solutions for microservices observability, enhancing system monitoring and troubleshooting capabilities in complex distributed environments.

Complete Docker Tutorial - From Basics to Advanced DevOps Practices
Master containerization fundamentals through hands-on practice with Docker, from basic concepts to advanced deployments using Docker Compose, Swarm, monitoring tools, and cloud integration with AWS and Kubernetes.
C3Power Monitoring at CCCamp 19
Visualisierung und Analyse des Stromnetzes beim CCCamp 2019: Aufbau, Betrieb und Ergebnisse des Low-Cost-Monitoringsystems unter extremen Bedingungen. Integration in DMR-Funknetz für Störungsmeldungen.
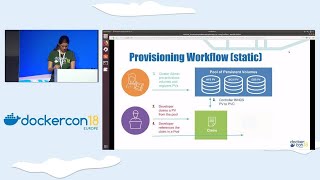
Provisioning and Managing Storage for Docker Containers
Explore Docker container storage concepts, focusing on provisioning, management, and advanced features for stateful applications. Learn about persistent volumes, data availability, and monitoring.
Observability with Consul Connect
Explore setting up and observing a service mesh platform using Consul Connect, focusing on effective monitoring through metrics, logs, and traces with Prometheus, Loki, Tempo, and Grafana.

Getting Started with Observability Lab - Opentracing, Prometheus, and Jaeger
Hands-on lab exploring observability tools for cloud-native applications. Install and use Prometheus, Grafana, and Jaeger to monitor Kubernetes clusters and instrument microservices for improved troubleshooting and diagnostics.
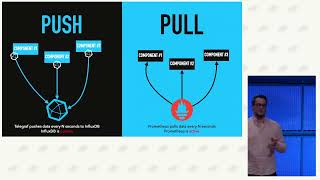
Modern Observability - Scalable Observability with the LGTM Stack - Harnessing the Power of Loki, Grafana, Tempo, and Mimir
Explore advanced observability using the LGTM stack (Loki, Grafana, Tempo, Mimir). Learn how it integrates with OpenTelemetry to enhance monitoring and tracing for high-performance systems.
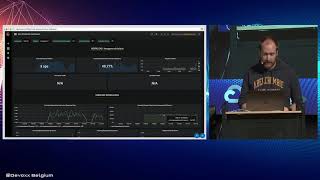
Istio, We Have a Problem! Understanding and Fixing Bugs with a Service Mesh
Explore Istio service mesh for debugging, monitoring, and deploying microservices. Learn to use Service Graph, Prometheus, Grafana, and traffic mirroring for effective problem-solving and blue-green deployment.

A Dashboard Is Worth a Thousand Words - Better Monitoring for Better Ops
Explore how CERN's new monitoring system improved service operations and fostered SRE practices, discussing design decisions, operational challenges, and the benefits of implementing SLIs/SLOs.
The Cloud Native Journey at Adobe
Explore Adobe's cloud-native journey: migrating enterprise products to Kubernetes, implementing DevOps, and leveraging tools like Envoy, Helm, and Prometheus for improved automation and visibility.

All Your Telemetry Data from Any Source in One Place
Learn to centralize telemetry data using OpenTelemetry standards and New Relic's platform. Hands-on labs cover data ingestion, visualization, and custom dashboard creation for efficient monitoring and issue resolution.
Prometheus - For Both Big and Little People
Explore Prometheus monitoring for small and large deployments, covering data collection, service discovery, alerting, storage, and visualization with Grafana.
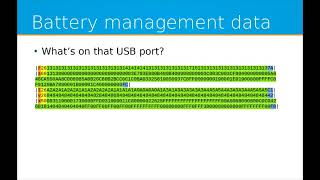
Decoding Battery Management Data - Back in the Old School
Explore decoding battery data from an electric motorbike using Raspberry Pi, Python, and open-source tools. Learn techniques for interpreting binary data from closed systems without documentation.
DAING - A Monitoring Stack for Datacentres
Explore a comprehensive monitoring stack for datacentres using Icinga, Netbox, Ansible, and Grafana. Learn to document, manage, and monitor infrastructure at scale in this hands-on lab session.

Performance Testing of Prometheus Based Metric Platforms
Discover how Hootsuite evaluated Prometheus and Grafana metrics platforms using load testing, and learn about their Locust-based framework for assessing performance impacts of configuration changes.
Custom Metrics with Pushgateway, Prometheus and Grafana
Explore custom metrics implementation using Pushgateway, Prometheus, and Grafana for effective monitoring and visualization of system performance and data analysis.
Using Bonobo, Airflow and Grafana to Visualize Your Business
Hands-on introduction to building business dashboards using Bonobo ETL, Airflow, and Grafana. Learn to create data pipelines, visualize metrics, and improve business insights through practical examples and real-world data.
Using Open Source Software to Collect Performance Metrics
Learn to set up an inexpensive system using Telegraf, InfluxDB, and Grafana to collect and visualize SQL Server performance metrics, aiding in troubleshooting and capacity planning.