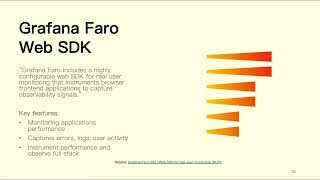
Grafana Alloy Best Practices: Multi-Tenant Design, Performance Optimization, and End-to-End Tracing
探索Grafana Alloy的多租户設計、性能優化和端到端追蹤,學習實施最佳實踐以提升監控和可觀察性能力。
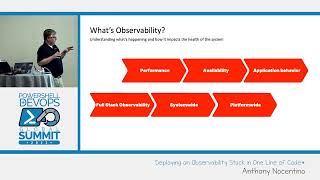
Deploying an Observability Stack in One Line of Code - PowerShell Summit 2023
Deploy an observability stack efficiently with a single line of code, enhancing system monitoring and troubleshooting capabilities for improved performance and reliability.
Observing and Optimizing Drupal 8 Websites with OpenTelemetry, Monolog, and Grafana
Implement observability in Drupal using OpenTelemetry, Monolog, and Grafana to track complex requests, optimize performance, and troubleshoot distributed architectures effectively.

Using InfluxDB for Real-Time Monitoring in JMeter
Integrate InfluxDB with JMeter for real-time performance monitoring, capturing metrics and visualizing results with Grafana to gain proactive insights into application performance.
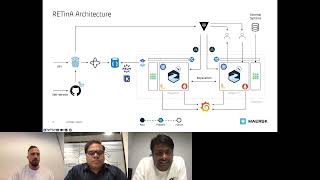
Transition to Apache Kafka on Kubernetes with Strimzi - A Migration Case Study
Explore Maersk's migration from Confluent to self-managed Apache Kafka on Kubernetes using Strimzi. Learn about architecture, implementation, monitoring, and self-service solutions for large-scale event streaming platforms.
Strengthening Software Operations: Observability, Encryption, and SSO - Operator Day Insights
Strengthen software operations with predictive observability, certificate-based encryption, and simplified SSO. Learn to integrate tools, secure communications, and automate identity management for enhanced efficiency and security.

Complete DevOps Project: Deploy GoLang App with Kubernetes, ArgoCD, Prometheus and Grafana
Deploy a secure GoLang app with Kubernetes, ArgoCD, Prometheus & Grafana. Learn modern DevOps practices for automated, secure, and scalable deployment pipelines using various tools and technologies.

Monitoring, Logging, and Security in DevOps
Implement monitoring, logging, and security in DevOps with hands-on exercises using Prometheus, Grafana, and CI/CD pipeline security measures.

Unifying Observability: Correlating Metrics, Traces, and Logs with Exemplars and OpenTelemetry
Discover how to correlate metrics, traces, and logs using OpenTelemetry SDK and Collector, enabling seamless navigation between observability signals for enhanced distributed system monitoring.
From Chaos to Calm - Building a Unified and Scalable CI/CD Pipeline
Discover how to build a unified CI/CD pipeline using cloud-native tools like Argo Rollouts and Backstage, improving development efficiency and reducing operational workload by 40% through streamlined workflows.
Shopify's Open Source Approach to Network Monitoring with eBPF, Vector and ClickHouse
Discover how to build a scalable network monitoring system using eBPF, Vector, and ClickHouse to process millions of events per second across Kubernetes clusters with real-world implementation insights.
Observability Data Volumes and Strategies for Managing System Growth
Explore strategies for managing growing observability data volumes, from historical growth patterns to current solutions and future possibilities in data processing and storage optimization.
Watching the Watchers: How We Do Continuous Reliability at Grafana Labs
Discover how Grafana Labs tackles production incidents, scales observability tools, and maintains reliability through real-world examples of monitoring challenges, failures, and successful solutions.

From Observability to Performance in Kubernetes - Metrics, Analysis, and Optimization
Discover how to optimize Kubernetes service performance through effective metrics collection, analysis, and bottleneck identification using tools like Prometheus, Grafana, and kube-burner for enhanced user experience.

Tame MTTR with Real-Time Anomaly Detection in Cloud-Native Systems
Master real-time anomaly detection techniques for Kubernetes clusters using statistical and ML algorithms to reduce MTTR, improve monitoring, and maintain optimal application performance.
Monitoring Raspberry Pi Servers with Telegraf, Influx, and Grafana
Master server monitoring with Telegraf, Influx, and Grafana to track Raspberry Pi performance metrics and create dynamic data visualizations for effective system management.