Ingress on the Rails - Use Community Tools to Automate Ingress Provisioning
Automate Ingress provisioning using community tools for secure, monitored HTTPS and HTTP/2 traffic across multiple Kubernetes clusters with ExternalDNS, cert-manager, and more.
Progressive Delivery in Kubernetes
Explore automated Progressive Delivery in Kubernetes using Jenkins X and Flagger, featuring Canary deployments and rollbacks for safer, more efficient software releases.
From Alert Notification to Comparison of Good and Bad Requests in One Click
Explore efficient troubleshooting by linking metrics, traces, and alerts. Learn to compare problematic and normal traces automatically, reducing time-to-mitigation using open-source tools like Prometheus and Jaeger.
Thanos - Highly Available, Pluggable, Long Term Metric Storage for Everyone
Explore Thanos: a scalable, highly available solution for long-term metric storage, enhancing Prometheus capabilities with multi-cluster telemetry, remote writes, and multi-tenancy features.
Practical Kubernetes Monitoring with Prometheus
Learn practical Kubernetes monitoring using Prometheus, covering setup, service discovery, alerting, and advanced topics like SLOs and security. Gain insights into best practices and real-world applications on GitLab.com.

Infrastructure Monitoring Basics with Telegraf, Grafana and InfluxDB
Learn infrastructure monitoring basics using Telegraf, Grafana, and InfluxDB. Explore data collection, storage, visualization, and alerting techniques to ensure system reliability and performance.
Logging, Metrics and Events in ASP NET Core
Explore effective application monitoring in ASP.NET Core, covering logging, metrics, and events. Learn to implement visibility tools and gain actionable insights for distributed systems.
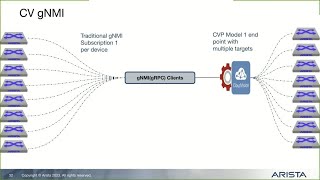
Streaming CloudVision Telemetry to External Sources Using gNMI
Discover how to stream CloudVision telemetry data to external platforms like Influx, Prometheus, and Grafana using gNMI interface for enhanced network monitoring and visualization.
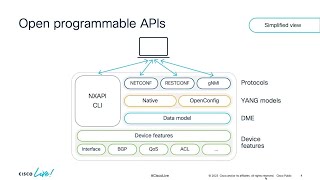
Integrating Streaming Telemetry on Cisco NX-OS with Open Source Tooling
Master network visibility by integrating NX-OS with open-source TIG stack for real-time monitoring, data visualization, and troubleshooting using Grafana dashboards and streaming telemetry.
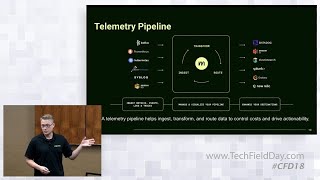
Understand and Optimize Logs, Metrics, Traces, and Events with the Mezmo Telemetry Pipeline
Master telemetry data optimization techniques for DevOps and SREs, covering data profiling, signal isolation, and dynamic pipelines to enhance observability platform performance and reduce costs.
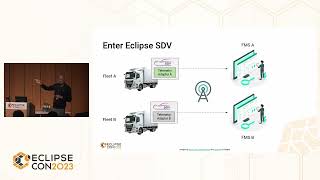
Trucks on a Leash - Fleet Management the Open Source Way
Discover how open-source technology revolutionizes truck fleet management, reducing costs through standardized data collection, cloud integration, and vendor-independent solutions for real-time vehicle monitoring.
Leveraging Apache Flight Python Client and InfluxDB for Time Series Data Management
Explore Apache Flight Python Client and InfluxDB integration for efficient time series data management. Learn about columnar storage, benchmarks, and real-world applications in data architecture.
Why Building an Observability Platform Is Still Challenging - PlatformCon 2023
Explore challenges in building observability platforms for "you write it, you run it" strategies. Examine key aspects hindering effective implementation and learn why traditional platform tools fall short.
Crafting and Leveraging Prometheus Metrics for Infrastructure Intelligence
Explore Prometheus metrics for data-driven infrastructure decisions. Learn query-building, tools, and data warehouse concepts to maximize insights from your system's metrics.
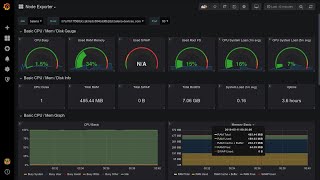
Installing and Configuring Prometheus - A Comprehensive Guide
Install, configure, and leverage Prometheus for effective system monitoring. Master data collection, querying, visualization, and alerting to gain valuable insights into your applications and infrastructure.
KubeVirt Observability with Prometheus and Grafana
Explore KubeVirt observability using Prometheus and Grafana for enhanced monitoring and visualization of virtualized workloads in Kubernetes environments.
Crash Course in Kubernetes Monitoring
Learn to instrument applications, gather metrics, and act on aggregate data for effective Kubernetes monitoring using Prometheus and Grafana in cloud-native environments.
BOLABuster - Harnessing LLMs for Automating BOLA Detection
Discover how to leverage LLMs for automated BOLA vulnerability detection in APIs and web applications, exploring BOLABuster's innovative approach to identifying critical security risks at scale.
Real-time Monitoring in a Containerized Environment Using Portainer, Prometheus and Grafana
Master effective container monitoring using Portainer, Prometheus, and Grafana, including optimization techniques, production challenges, and practical solutions for infrastructure oversight.
從零開始打造私有雲的 Kubernetes 監控 - 使用 Prometheus 和 Grafana
從零開始學習如何使用Prometheus和Grafana為私有雲Kubernetes建立監控系統,並了解常用CRDs以創建自定義監控報表。

Grafana 全家桶:打造高可用且具可擴充性的 O11y 平台
探索如何利用Grafana生態系打造高可用、可擴充的監控平台,涵蓋metrics、logging和tracing,並與常見解決方案比較優勢。