Why Are Distributed Systems So Hard?
Explore distributed systems' challenges, from CAP theorem myths to network partitions. Learn consensus algorithms, system design for adaptability, and strategies to mitigate risks in distributed computing.
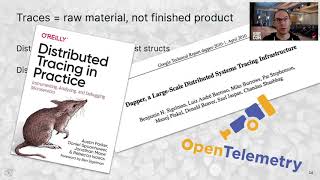
Building Service Ownership Using Documentation, Telemetry, and a Chance to Make Things Better
Explore strategies for building distributed service ownership in software teams, focusing on documentation, telemetry, and empowering teams to drive improvements in system reliability and performance.
Identifying Hidden Dependencies
Discover how Honeycomb improved system reliability through intentional node termination, uncovering bugs and progressing towards continuous experimentation for enhanced resilience and scalability.
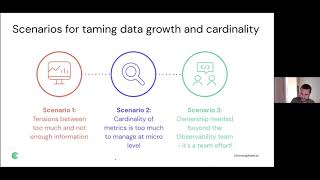
Taking Control of Metrics Growth and Cardinality - Tips for Maximizing Your Observability
Strategies for managing metrics growth and cardinality in cloud-native environments, focusing on best practices, KPIs, and team collaboration to enhance observability and streamline remediation processes.
Take Me Down to the Paradise City Where the Metric Is Green and Traces Are Pretty
Explore OpenTelemetry for cloud-native observability, including its APIs and SDKs. Learn how to implement traces and metrics in Java and Go, with practical examples and insights on framework stability.
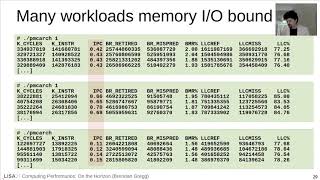
Computing Performance - On the Horizon
Explore future computing performance trends in processors, memory, storage, networking, and cloud technologies, with insights on emerging innovations and their potential impact.
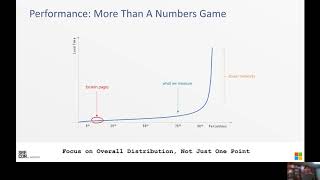
Off the Beaten Path - Moving Observability Focus from Your Service to Your Customer
Exploring customer-centric observability beyond traditional metrics, emphasizing direct engagement, user experience capture, and rethinking performance to enhance SRE practices and improve overall service quality.
Can You Roll Your Own SIEM
Explore building a custom cloud-native SIEM solution, discussing considerations, requirements, and benefits compared to vendor options. Learn about cost savings and improved capabilities.
With Friends Like eBPF, Who Needs Enemies?
Explore eBPF's evolution from network monitoring to a powerful Linux kernel observability tool, its security implications, and potential misuse by attackers.
Shit, Our Site is Down! Let's Build a Culture of Reliability
Discover strategies for building a culture of reliability in Angular apps, focusing on observability, service level indicators, and objectives to minimize downtime and improve performance.
Deep Dive - Prometheus
Explore Prometheus with maintainers in an open Q&A session. Dive deep into its inner workings, features, and future developments. Get expert insights on monitoring, storage, security, and performance optimization.

Intro - Jaeger
Explore Jaeger and distributed tracing for cloud-native app observability. Learn current features, future roadmap, and how Jaeger enhances monitoring in microservices architectures.
O-1, O-n and O-
Learn to identify and fix common performance issues in your code using OpenTelemetry tools, and implement automated performance testing for long-term optimization.
Exporting Your Trace Telemetry with OpenTelemetry and Fluent Bit
Learn to collect and export trace telemetry using OpenTelemetry and Fluent Bit for efficient cloud-native application monitoring and observability.
Observability for Air Conditioners - An IoT Story with Talos
Explore how Prometheus and observability tools are applied to IoT devices like air conditioners, addressing challenges and opportunities in real-world data monitoring beyond traditional Kubernetes environments.
Observability with Consul Connect
Explore setting up and observing a service mesh platform using Consul Connect, focusing on effective monitoring through metrics, logs, and traces with Prometheus, Loki, Tempo, and Grafana.
CNCF SIG Observability Updates
Updates on CNCF SIG Observability's progress, future plans, and opportunities for involvement. Overview of observability landscape, ongoing projects, and invitation to contribute to improving CNCF's observability space.
Extending OpenTelemetry to Observability
Explore OpenTelemetry's role in observability, learn how to enhance it with automation and AI for faster problem resolution in complex environments through a real-world case study and demo.
Log Support in OpenTelemetry
Explore OpenTelemetry's log support, including data model, implementation in Java, collector support, and future plans. Learn about instrumentation libraries and log collection.
Compliance the Easy Way - Zero-conf mTLS for Dev and Smooth Day-2 for Ops
Explore zero-conf mTLS implementation with Linkerd for secure, observable, and reliable application infrastructure in financial contexts, including insights on integration and long-term operations.

Getting Started with Observability Lab - Opentracing, Prometheus, and Jaeger
Hands-on lab exploring observability tools for cloud-native applications. Install and use Prometheus, Grafana, and Jaeger to monitor Kubernetes clusters and instrument microservices for improved troubleshooting and diagnostics.