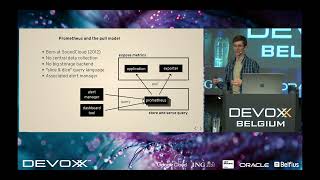
The Science of Signals - Mastering Telemetry for Observability
Dive into the science behind telemetry signals in this comprehensive conference talk on mastering observability. Explore the complexities of modern software systems and learn how to choose the right tools and signals to understand their behavior, perform…
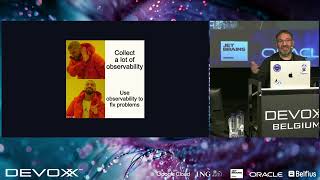
Find and Fix Performance Issues in Your Code Using Digma
Discover how to identify and resolve performance issues in Java code using Digma, a free IDE plugin, in this 36-minute Devoxx conference talk. Learn about Digma's utilization of OpenTelemetry to collect and analyze traces and metrics, enabling the detect…
Jenkins Pipeline Analytics with OpenTelemetry - Dynatrace Tips and Tricks
Optimize Jenkins pipelines and infrastructure using OpenTelemetry for analytics. Identify root causes of failing or problematic jobs, stages, and steps to enhance engineering productivity.
What's New in Dynatrace - Release 1.287
Explore Dynatrace v1.287 updates: AppSec event deprecation, K8s enhancements, email notifications for new sign-ins, and OpenTelemetry syslog integration. Gain insights through live demos and expert explanations.
Unlocking Kubernetes Insights - Diagnosing Health with Dynatrace and External Agents
Explore Kubernetes health diagnostics using Dynatrace and external agents. Learn to collect logs, compare agents, monitor critical data, and implement autoscaling rules for confident cluster operation.
OpenTelemetry Demo App with Dynatrace - Setup and Data Exploration
Explore OpenTelemetry's capabilities through a demo app, learning to set up and analyze distributed traces and metrics in Dynatrace within minutes.
GraphQL and OpenTelemetry: Observing, Diagnosing, and Optimizing - Observability Clinic
Explore GraphQL's challenges and learn to observe, diagnose, and optimize using OpenTelemetry. Gain insights into problem patterns, instrumentation techniques, and future developments in this comprehensive guide.
OpenObservability Without Boundaries with Dynatrace
Explore OpenObservability with Dynatrace: ingest data from various sources, connect logs, metrics, and traces, analyze with DQL and notebooks, and automate tasks through workflows.
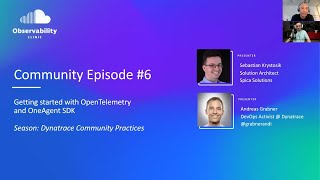
Getting Started with OpenTelemetry and OneAgent SDK Instrumentation - Episode 6
Explore manual code instrumentation, OpenTelemetry for C++, and OneAgent SDK for Ruby and Delphi. Learn best practices and see live demos for effective application monitoring and tracing.
GitLab Pipelines Observability with OpenTelemetry and Dynatrace
Gain insights into complex GitLab pipelines using OpenTelemetry and Dynatrace. Learn to implement observability, analyze traces, and leverage dashboards for enhanced pipeline management.
Self-Service Log-Driven Problem Detection with Dynatrace
Detect critical problems using logs and streamline troubleshooting with Dynatrace. Learn to automate incident detection and response for custom and packaged applications in any environment.
AI and LLM Observability with Dynatrace - Tutorial and Demo
Explore OpenTelemetry-based AI and LLM observability across infrastructure, model, semantic, orchestration, and application layers. Learn to optimize performance, understand costs, and ensure accurate responses in AI adoption.
What's New in Dynatrace - Release 1.292
Explore Dynatrace v1.292 updates: Metrics on Grail GA, platform enhancements, AppSec improvements, and infrastructure changes. Gain insights into new features and their practical applications.
Enhancing the Observability of LLM Using OTel and Auto Python Probe Injection
Discover how to enhance LLM observability using OpenTelemetry and Python probe injection techniques, focusing on practical implementation within Apache systems.
Enabling Observability with OpenTelemetry
Explore OpenTelemetry for enhanced observability in distributed systems, covering key concepts, architecture, instrumentation techniques, and practical implementation examples.
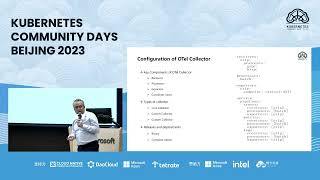
OpenTelemetry Best Practices for Open Observability Implementation
OpenTelemetry实现开放可观测性的最佳实践:自动和手动检测、语义约定、OTel Collector部署和配置,包括日志、追踪和指标导出器,以及处理器和接收器的使用。
Everything You Need to Know About OpenTelemetry
Aprenda os fundamentos essenciais do OpenTelemetry para monitoramento e observabilidade em ambientes de nuvem nativa, melhorando a visibilidade e o desempenho de suas aplicações.
Balancing Cost and Quality in OpenTelemetry: An Evaluation of Sampling Policies
分布式追踪中的采样策略评估:探讨OpenTelemetry中不同采样策略的成本和质量权衡,分享定量分析经验,介绍覆盖边缘案例的策略,助您为业务定制最佳采样方案。
Large-Scale Financial-Grade Platform Engineering Practice in China Merchants Bank
探索中国招商银行如何利用云原生技术和平台工程实践实现数字化转型,平衡安全合规与创新,优化开发流程,提高效率并确保风险控制。
The Journey of Next-Gen FinTech IDP at China Merchants Bank
探索中国招商银行的云原生转型之旅:如何利用先进技术构建下一代金融科技IDP,提升开发效率,管理复杂应用,为金融机构数字化转型提供参考。
Fluent Bit in 2022: Logs, Prometheus and OpenTelemetry
Explore Fluent Bit's expanded capabilities in observability, covering logs, metrics, and traces collection. Learn to optimize data pipelines using OpenMetrics and OpenTelemetry for efficient production environments.