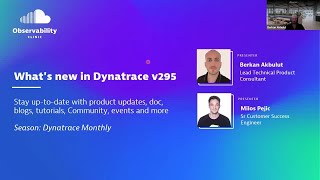
What's New in Dynatrace - Release 1.295
Explore Dynatrace v1.295 updates: enhanced DQL queries, improved dashboards, new log ingestion features, maintenance window improvements, and expanded Kubernetes container properties.
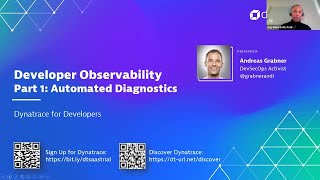
Developer Observability - Automated Diagnostics - Part 1
Explore automated diagnostics in Dynatrace for efficient code execution, root cause analysis, and problem detection in distributed environments. Learn to leverage observability data effectively.
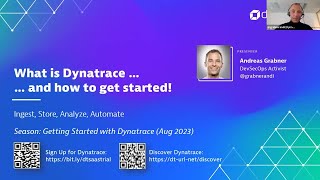
Introduction to Dynatrace: Platform Overview and Hands-On Tutorial
Explore Dynatrace's AI-powered platform for monitoring and optimizing applications, infrastructure, and user experience. Gain hands-on experience with key features and use cases.
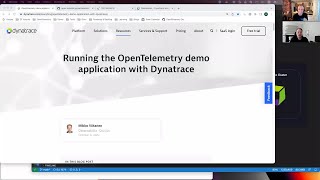
OpenTelemetry Demo App with Dynatrace - Setup and Data Exploration
Explore OpenTelemetry's capabilities through a demo app, learning to set up and analyze distributed traces and metrics in Dynatrace within minutes.
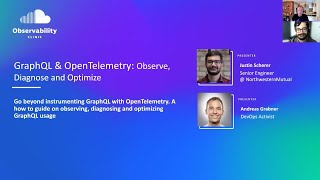
GraphQL and OpenTelemetry: Observing, Diagnosing, and Optimizing - Observability Clinic
Explore GraphQL's challenges and learn to observe, diagnose, and optimize using OpenTelemetry. Gain insights into problem patterns, instrumentation techniques, and future developments in this comprehensive guide.
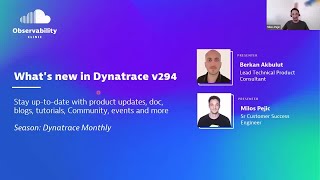
What's New in Dynatrace - Release 1.294
Explore Dynatrace 1.294 updates: privacy enhancements, Session Replay extension, improved application observability, new DQL functions, and enriched software component information.
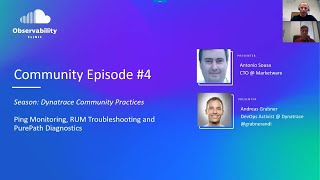
Dynatrace Tips and Tricks - Network Latency, RUM Troubleshooting, and Trace Diagnostics
Explore advanced Dynatrace techniques: network latency monitoring, RUM troubleshooting, and performance hotspot identification. Enhance your observability skills with expert insights.
Observing GraalVM Native Images with Dynatrace
Discover how Dynatrace enables comprehensive observability for GraalVM Native Image applications in cloud-native environments, including end-to-end distributed tracing and performance optimization.

Java and Spring Boot Microservices - Full Course
Comprehensive guide to building microservices with Spring Boot, covering essential concepts like service discovery, load balancing, and containerization using Docker and Kubernetes.
Deploy Spring Microservices to Azure
Deploy Spring microservices to Azure: Create clusters, configure servers, build and deploy microservices, set up gateways, use service registry, and implement distributed tracing for efficient debugging.
Spring Boot Microservices
Comprehensive guide to building resilient microservices using Spring Boot and Spring Cloud, covering service discovery, API gateway, circuit breaking, configuration management, logging, and distributed tracing.
Enhancing the Observability of LLM Using OTel and Auto Python Probe Injection
Discover how to enhance LLM observability using OpenTelemetry and Python probe injection techniques, focusing on practical implementation within Apache systems.
Enabling Observability with OpenTelemetry
Explore OpenTelemetry for enhanced observability in distributed systems, covering key concepts, architecture, instrumentation techniques, and practical implementation examples.
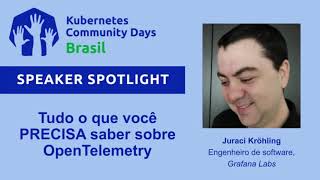
Everything You Need to Know About OpenTelemetry
Aprenda os fundamentos essenciais do OpenTelemetry para monitoramento e observabilidade em ambientes de nuvem nativa, melhorando a visibilidade e o desempenho de suas aplicações.
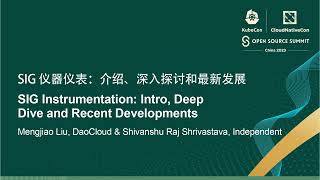
SIG Instrumentation: Introduction, Deep Dive, and Recent Developments
深入探讨Kubernetes SIG Instrumentation的工作,包括分布式跟踪、日志关联和结构化日志等最新进展,以及如何利用原生工具调试集群并为SIG做出贡献。
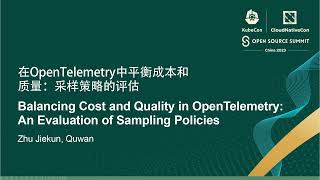
Balancing Cost and Quality in OpenTelemetry: An Evaluation of Sampling Policies
分布式追踪中的采样策略评估:探讨OpenTelemetry中不同采样策略的成本和质量权衡,分享定量分析经验,介绍覆盖边缘案例的策略,助您为业务定制最佳采样方案。

Observabilidad en Python para Principiantes
Descubre los fundamentos de la observabilidad en Python: registros, métricas y seguimiento. Aprende a implementar estas técnicas esenciales para mejorar el desarrollo de software con ejemplos prácticos y herramientas clave.
MicroProfile 5.0 and Future Releases - Updates and Roadmap
Discover the latest MicroProfile 5.0 updates, including jakarta.* namespace integration, metrics improvements, and future roadmap through a practical demonstration using Open Liberty.
CNCF Project Updates - Keynote
Explore CNCF project updates from industry experts, covering Chaos Mesh, argoflux, Longhorn, Operator Framework, cri-o, Falco, NATS, Jaeger, Prometheus, Rook, and Helm.

How Lyft Used Envoy to Rethink Microservice Development
Lyft's innovative approach to microservice development using Envoy, enabling efficient scaling and debugging through a shared staging environment and custom Envoy filters for improved engineer productivity.
Cloud Native Updates and Key CNCF Projects - Keynote
Explore cloud-native updates, including CNCF's latest projects Envoy and Jaeger, and their impact on distributed systems and tracing in this insightful keynote by Chris Aniszczyk.