IKEA Private Cloud - eBPF-Based Networking, Load Balancing, and Observability with Cilium
Explore IKEA's large-scale Kubernetes environment, focusing on Cilium and eBPF for improved networking, load balancing, and observability across distributed data centers.
OpenTelemetry: The Road Ahead and Meet the Community
Explore OpenTelemetry's future, recent releases, and roadmap with project leaders. Join a panel discussion and Q&A session to learn about observability advancements and community involvement.

Building an Agile Platform in a Highly Regulated Industry
Discover how a leading Nordic insurer built an agile Kubernetes-based platform, balancing innovation with strict regulatory requirements through GitOps, immutable infrastructure, and strategic onboarding.
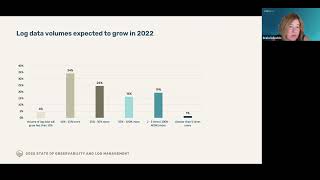
2022 State of Observability and Log Management
Explore the latest trends and advancements in observability and log management for cloud-native environments in this comprehensive industry overview.
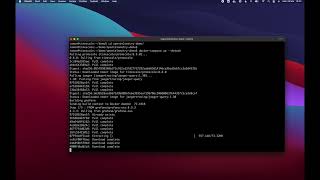
Understanding Your System with OpenTelemetry, Grafana, and Promscale
Explore advanced system monitoring using OpenTelemetry, Grafana, and Promscale. Learn to visualize latency, trace services, and analyze dependencies for enhanced performance insights.
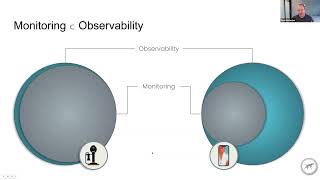
The Future of Observability in Cloud Native Systems
Explore the evolving landscape of observability in complex systems, focusing on Open Telemetry as a key trend and its impact on data collection and monitoring practices.
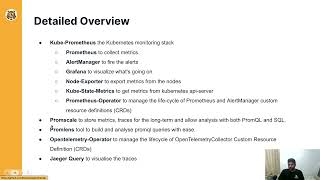
Deploy a Full CNCF-Based Observability Stack in Under 5 Minutes with Tobs
Deploy a full CNCF observability stack quickly with tobs, exploring its components, architecture, and features. Learn about Promscale, dashboards, and monitoring tools for efficient cloud-native observability.
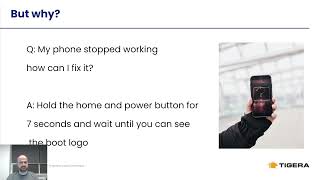
eBPF Observability for Cloud Native Systems
Explore eBPF's powerful observability capabilities for cloud-native environments, enhancing system monitoring and performance analysis in modern infrastructure.
Tail-Based Sampling in OpenTelemetry Collector - Why, How, and Issues
Explore tail-based sampling in OpenTelemetry Collector: benefits, configuration, implementation in microservices, and current challenges for production deployments.

Better Reliability Through Observability and Experimentation
Explore techniques for improving system reliability through observability and experimentation, including simulated outages, OpenTelemetry, and OpenTracing to enhance service performance and resilience.

OpenTelemetry: The Vision, Reality, and How to Get Started
Explore OpenTelemetry's unified framework for observability data collection, its current state across projects, and practical guidance for implementation in your system.
CNCF TAG Observability: Introduction and How to Join
Discover CNCF TAG Observability's role, activities, and how to contribute to improving the cloud-native observability ecosystem. Learn about key projects, tools, and future developments in this domain.
Prometheus: Introduction and Deep Dive - From Basics to New Features
Comprehensive overview of Prometheus monitoring system, covering architecture, data model, querying, alerting, and recent feature updates for efficient cloud-native observability.
From Monitoring to Observability: Left Shift Your SLOs with Chaos
Explore the journey from monitoring to observability, integrating SLOs and chaos engineering in CI/CD pipelines for improved application performance and reliability.

Show Me Your Labels - Exploiting Kubernetes Label Systems
Explore the power of Kubernetes labels in modern logging, tracing, and metric systems. Learn to correlate inputs, transform logs to metrics, and maximize label usage for enhanced system management.
Energy Efficient Placement of Edge Workloads
Explore Kepler for container-level energy metrics in Kubernetes, enabling efficient workload placement and sustainable cluster management through integration with observability tools.
The Amazing Trace: Enhancing Distributed WebAssembly with OTEL
Explore how OTEL tracing enhances distributed WebAssembly in wasmCloud, improving observability and debugging for developers in complex distributed systems.
Confidence with Chaos for Kubernetes Observability
Explore Kubernetes observability with Prometheus, SLOs, and chaos engineering. Learn practical insights for SREs and developers to enhance metrics, alerting, and incident response in production environments.
Adopting Open Telemetry Collector at eBay - Swapping Engines Mid-Flight
Explore eBay's transition from Elastic Beats to Open Telemetry Collector, addressing scale challenges in Kubernetes, annotation-based discovery, and ensuring seamless metric collection during migration.
Leveraging OpenTelemetry for Your Prometheus Pipeline
Explore OpenTelemetry's integration with Prometheus, covering receivers, exporters, migration paths, and common scenarios for leveraging OTel in your metrics pipeline.
Opening the Door to Observability
Explore the impact of observability across organizations, learn strategies to advocate for investment, and understand the importance of open tools in enhancing business operations and user experiences.