
Module Federation and Micro-Frontend Architecture - How It Works
Explore module federation, micro-frontends, and Zephyr Cloud's innovative approach to simplifying developer workflows, enhancing productivity, and enabling real-time edge deployment for modern web applications.
Keeping an Eye on Your Node Apps: Observability and Performance Monitoring
Learn effective monitoring techniques for Node.js applications at scale, covering observability, event logs, system metrics, and tracing with open-source tools and Logz.io integration.
Knee Deep in Microservices - Challenges and Cloud Native Solutions
Explore microservices architecture, its challenges, and cloud-native solutions. Learn about containerization, scheduling, monitoring, and best practices for implementing scalable, resilient systems.
InfluxDB & Rust
Explore InfluxDB 3.0's Rust rewrite, focusing on improved performance, scalability, and observability data handling. Learn about IOx engine, Flux language, and open-source considerations.
Monitoring Kubernetes Network Traffic Using eBPF
Discover how to leverage eBPF technology for effective monitoring and analysis of Kubernetes network traffic patterns in cloud-native environments.
The Anatomy of a Distributed Trace - Understanding OpenTelemetry and Observability
Delve into distributed tracing fundamentals, exploring OpenTelemetry implementation, trace components, metadata analysis, and how logs and metrics support system-wide monitoring and troubleshooting.
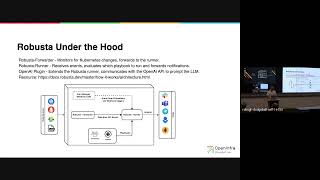
Using Robusta and ChatGPT to Fix Kubernetes Infrastructure and Apps
Discover how Robusta integrates with ChatGPT to streamline Kubernetes troubleshooting, interpret alerts, and implement quick fixes for infrastructure and application issues.
Tracing Adventures from Pull Request to Production - Using OpenTelemetry for Deploy Troubleshooting
Discover how distributed tracing and OpenTelemetry signals can improve collaboration between developers and operators while troubleshooting deployment issues from PR to production.
What is OpenTelemetry - Understanding Core Concepts and Implementation
Discover OpenTelemetry's core components, implementation strategies, and practical applications for logs, metrics, and tracing in modern cloud-native environments through hands-on examples and real-world scenarios.
Practical Introduction to OpenTelemetry Tracing
Master distributed system monitoring with OpenTelemetry tracing, exploring implementation techniques and best practices for tracking requests across microservices architectures using open standards.
AI Operations: Evolution, Challenges and Solutions in Modern IT Infrastructure
Explore the evolution and implementation challenges of AI Ops, from historical Big Data solutions to modern artificial intelligence integration in IT operations management and workflow optimization.
eBPF Observability Workshop
Dive into advanced eBPF observability techniques with an experienced Intel technologist, covering kernel development, system programming, and networking optimization for robust software implementation.
Making Java Applications Observable with OpenTelemetry - No Code Changes Required
Discover how to implement OpenTelemetry in Java applications for enhanced monitoring and observability across microservices, without modifying existing code. Learn configuration techniques and trace propagation.
Storing Continuous Benchmarking Data in Prometheus
Explore using Prometheus for benchmarking distributed systems, gaining insights into performance issues through comprehensive metric collection and analysis.
Fleeting Metrics: Monitoring Short-lived or Serverless Jobs with Prometheus
Explore solutions for monitoring short-lived workloads and serverless jobs using Prometheus, addressing challenges and demonstrating best practices for capturing fleeting metrics in cloud-native environments.
Warp-Speed Debugging with Prometheus Exemplars
Discover how Prometheus exemplars enhance debugging efficiency in distributed systems by seamlessly connecting metrics, logs, traces, and profiles for faster issue resolution.
Step by Step Kubernetes Observability with eBPF
Explore eBPF for Kubernetes observability, from writing and deploying programs to gathering network metrics and building communication graphs. Hands-on demo with BumbleBee project.
MLExray - Observability for Machine Learning on the Edge
Explore MLExray, an open-source framework for debugging ML models on edge devices. Learn to identify and solve common deployment issues, ensuring optimal performance across diverse environments.
Make Cloud Native Chaos Engineering Easier - Deep Dive into Chaos Mesh
Explore Chaos Mesh, a popular open-source platform for cloud native chaos engineering. Learn implementation, best practices, and how to enhance observability in chaos experiments for improved efficiency.
Story of Correlation: Integrating Thanos Metrics with Observability Signals
Explore integrating Thanos metrics with other observability signals for enhanced monitoring. Learn end-to-end correlation techniques to improve Kubernetes cluster observability beyond basic metrics.
Introduction to Media Streaming Mesh
Explore Media Streaming Mesh, a concept enabling real-time media apps in Kubernetes. Learn how it addresses RTP compatibility issues and supports microservices architecture for cloud-native infrastructure.