Observing Kubernetes Networking with Cilium, Hubble, and Grafana
Explore Kubernetes networking observability using Cilium, Hubble, and Grafana. Learn to visualize application communication, debug issues, and uncover underlying problems in complex cloud-native environments.
OpenTelemetry Community Demo - Cloud Native Live
Explore OpenTelemetry's capabilities in this live demo, showcasing its observability features and integration with cloud-native applications.
Intro to Kubernetes, GitOps, and Observability - Hands-On Tutorial
Hands-on tutorial exploring Kubernetes, GitOps, and Observability. Learn key concepts, practice commands, and experience benefits like improved reliability, velocity, and security in cloud-native environments.
Analyzing and Visualizing OpenTelemetry Traces with SQL
Hands-on workshop exploring OpenTelemetry trace analysis using SQL and Grafana. Learn to ingest, query, and visualize distributed system data for powerful insights and proactive issue detection.
State of the OpenTelemetry Community - Keynote
Comprehensive overview of OpenTelemetry's community progress, achievements, and future roadmap, presented by governance committee members Morgan McLean and Alolita Sharma.
The Unexplored World of OpenTelemetry and Service Mesh
Explore the pros and cons of using service mesh tools like Istio for generating traces compared to OpenTelemetry. Learn about sampling, third-party services, implementation, and visualization to make informed decisions.
Continuous Profiling in Cloud Native Applications
Explore continuous profiling in cloud-native environments, discussing implementation strategies, challenges, and its integration with service mesh and observability tools.
Meet the OpenTelemetry Maintainers Panel - Deep Dive into Metrics Specification
Panel discussion on OpenTelemetry Metrics specification, exploring its unique features, Prometheus compatibility, and future directions. Opportunity for Q&A with maintainers to gain insights into this evolving technology.

OTel Me All About OpenTelemetry - Introduction to OpenTelemetry
Explore OpenTelemetry's observability framework, its components, and implementation strategies for effective application monitoring and performance optimization.
Prometheus Instrumentation: The Practical Way
Learn practical Prometheus instrumentation techniques for complex applications, covering metric types, real-world examples, and unit testing strategies to effectively monitor and analyze application behavior.
CNL - Using OTel Distributed Tracing for Real-Time Observability
Explore real-time observability with OTel distributed tracing, covering challenges, deployment architecture, service maps, and error detection in cloud-native environments.
Argo CD Observability with AIOps - Detecting Incidents Faster
Explore Intuit's integration of AIOps with Argo CD for enhanced observability, faster incident detection, and improved MTTD/MTTR in Kubernetes environments.
Cloud Native Superpowers with eBPF
Explore eBPF's role in cloud native tech, enabling powerful networking, security, and observability tools without modifying applications or configurations.
Stateless Collectors for Stateful Data: Scaling Prometheus as a Node Agent
Explore scaling Prometheus as a node agent using stateless collectors. Learn about an operator-based approach, new CRDs, and challenges in managing Prometheus at scale on Kubernetes.
SLO-Based Observability for All Kubernetes Cluster Components
Explore Pyrra for easy SLO management with Prometheus. Learn to deploy on Kubernetes, set up SLOs for cluster components, and improve on-call experiences through effective alerting.
Root-Causing Incidents Without Re-Deploying Production - Using bpftrace for Kubernetes Debugging
Explore bpftrace for efficient incident root-cause analysis in Kubernetes, capturing crucial data without redeploying pods. Learn tips and tricks for leveraging Pixie to streamline bpftrace deployment and data collection.
OTTL Me Why: Transforming Telemetry in the OpenTelemetry Collector - Just Got Better
Explore OpenTelemetry Transformation Language (OTTL) for processing telemetry data in the OpenTelemetry Collector. Learn use cases, best practices, and future developments for effective data transformation and routing.
Energy Observability Using Kepler - Revolutionizing Cloud Efficiency
Explore Kepler, an innovative framework for monitoring power consumption in Kubernetes environments, enhancing cloud efficiency through advanced observability techniques and machine learning.
Monitoring and Metadata - Exploring Approaches to Attaching Metadata to Logs, Metrics and Traces
Explore approaches for attaching metadata to logs, metrics, and traces in complex systems. Learn how metadata enhances observability, enables effective troubleshooting, and improves analysis in monitoring systems.
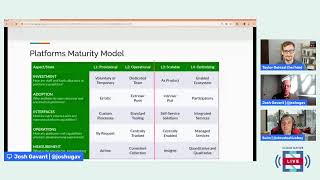
Cloud Native - What Developers Need from Platform Engineering
Explore platform engineering essentials for developers in cloud-native environments, focusing on key benefits and best practices for efficient software development and deployment.
Handling Billions of Metrics with Prometheus and Thanos
Learn how Intuit leverages Prometheus and Thanos to handle 2 billion active time series metrics, exploring scalable solutions for live metrics, AIOPS, event streaming, and deployment strategies.