Integrate Single-Cell RNA-Seq Datasets in R Using Seurat - Detailed Seurat Workflow Tutorial
Comprehensive tutorial on integrating single-cell RNA-Seq datasets using Seurat in R, covering data merging, batch effect correction, and visualization techniques for improved analysis.

How to Analyze Single-Cell RNA-Seq Data in R - Detailed Seurat Workflow Tutorial
Comprehensive tutorial on analyzing single-cell RNA-Seq data using Seurat in R, covering data processing, quality control, normalization, dimensionality reduction, and clustering for genomics research.

Visualize Gene Expression Data in R Using Ggplot2 - Bioinformatics for Beginners
Learn to visualize gene expression data using R and ggplot2. Create barplots, density plots, boxplots, scatterplots, and heatmaps from RNA-Seq data. Hands-on tutorial for beginners in bioinformatics.
How to Manipulate Gene Expression Data from NCBI GEO in R Using Dplyr - Bioinformatics for Beginners
Learn to manipulate gene expression data from NCBI GEO using R and dplyr. Covers data reading, metadata retrieval, and essential dplyr functions for effective bioinformatics analysis.
Prepping Data for Analysis in R
Comprehensive workshop on data preparation for analysis in R, covering common issues, automated solutions, and practical demonstrations using open-source tools and packages.
R for Data Scientists and Data Analysts
Master essential R skills for data analysis and science, covering variables, vectors, functions, and control structures in a comprehensive tutorial.
Learn to Use Databricks for Data Science
Discover how Databricks simplifies data science with a unified platform for analytics workloads, from data preparation to predictive analytics, enhancing collaboration and productivity at scale.
Master Databricks and Apache Spark - SparkR Usage - Lesson 35
Explore SparkR for integrating R with Databricks and Apache Spark, covering architecture, APIs, libraries, and practical examples of data manipulation and analysis.
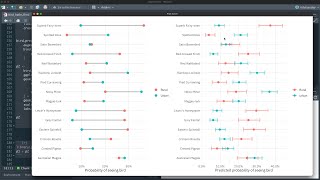
Fit and Predict With Logistic Regression for Bird Bath Observations in Australia
Learn to model bird bath observations in Australia using tidymodels, combining model specifications with feature engineering recipes for effective fitting and prediction.
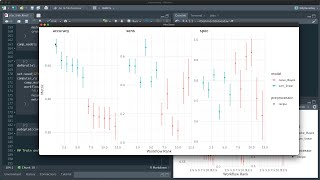
Use Tidymodels Workflowsets to Predict Human-Computer Interactions from Star Trek
Explore machine learning with tidymodels workflowsets to predict speaker type in Star Trek interactions, featuring data preprocessing, model evaluation, and result analysis.

Predict Housing Prices in Austin TX with Tidymodels and XGBoost
Explore feature engineering for boosted tree models using Austin housing data. Learn to incorporate text information as indicator variables and tune models for accurate price predictions.
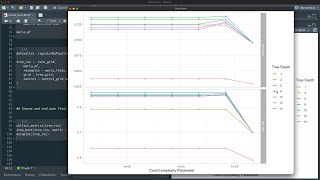
Partial Dependence Plots for Mario Kart World Records
Explore decision tree modeling and partial dependence profiles for Mario Kart world records using tidymodels and DALEX, with a focus on predicting shortcut usage.
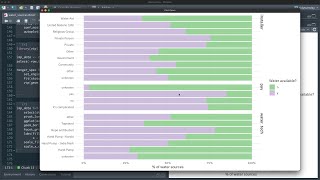
Predict Water Availability in Sierra Leone With Random Forests
Explore random forest modeling with tidymodels to analyze water sources in Sierra Leone, covering data preparation, model building, and evaluation techniques.
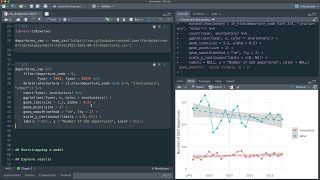
Estimate Change in CEO Departures With Bootstrap Resampling
Explore bootstrap resampling with tidymodels to analyze trends in CEO departures, using generalized linear models and #TidyTuesday data.
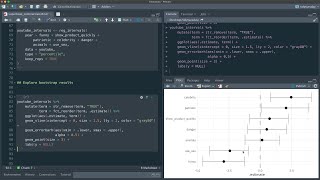
Compute Bootstrap Confidence Intervals for Super Bowl Commercial Characteristics
Explore how Super Bowl commercial characteristics evolve over time using tidymodels for bootstrap confidence intervals and data visualization techniques.
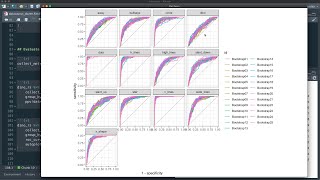
Predict Class Membership for the Datasaurus Dozen With Tidymodels
Explore multiclass evaluation metrics for random forest models using the Datasaurus Dozen dataset, focusing on model performance and visualization techniques.
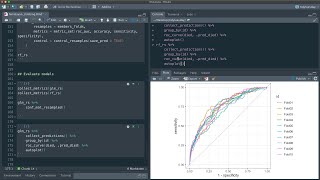
Impute Missing Data and Handle Class Imbalance for Himalayan Climbing Expeditions
Learn to predict survival in Himalayan climbing expeditions using tidymodels in R. Explore data handling, imputation, and modeling techniques for imbalanced datasets.
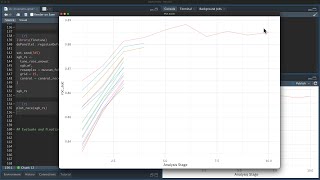
How to Handle High Cardinality Predictors for Data on Museums in the UK
Explore effect and likelihood encodings for high cardinality predictors in tidymodels, using UK museum data to demonstrate practical applications.
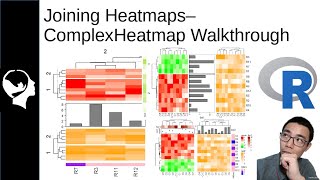
Joining Multiple Heatmaps - ComplexHeatMap Tutorial
Learn to combine multiple heatmaps in R using ComplexHeatmap. Master horizontal and vertical merging, customization, and annotations for effective data visualization in bioinformatics.
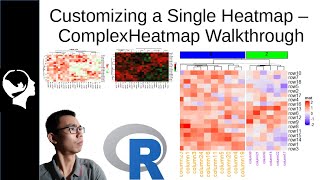
Creating a Heatmap in R - ComplexHeatmap Tutorial Part 1
Learn to create intricate heatmaps in R using ComplexHeatmap package. Master setup, color customization, title modification, and data ordering for effective visualization of multidimensional genomic data.
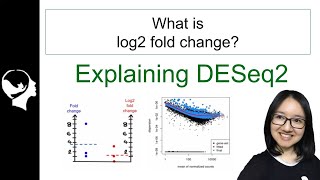
Log2 Fold-Change & DESeq2 Model in a Nutshell
Explore log2 fold-change, DESeq2 model, and differential expression analysis challenges. Learn the theory behind DESeq2 and its practical application in R for bioinformatics research.