
R Programming for Beginners - Learn R in 3 Hours
Comprehensive introduction to R programming, covering data types, manipulation, visualization, and neural networks. Includes hands-on examples and a Pokemon case study for practical application.
Data Visualization with ggplot2 in R
ggplot2 is the most popular package for data visualization. It is based on Grammar of Graphics which makes visualization extremely easy.

R Programming Crash Course
Comprehensive introduction to R programming, covering installation, data types, data manipulation with dplyr, visualization with ggplot2, and practical data analysis techniques for beginners.

Explore and Analyze Data with R
Explore, analyze, and visualize data using R programming language. Learn to use packages like ggplot2, dplyr, and tidyr to transform raw data into insights and knowledge.

RStudio Tutorial
Comprehensive RStudio tutorial covering statistical analysis, data visualization, bioinformatics, machine learning, and more. Ideal for beginners and advanced users seeking practical skills in R programming.
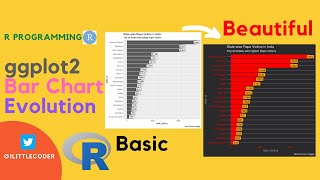
Make a Beautiful Ggplot2 Bar Chart from Basic to Powerful Themes
Learn to create stunning ggplot2 bar charts in R, from basic techniques to advanced theming. Master data cleaning, chart customization, and professional visualization using real-world crime data.
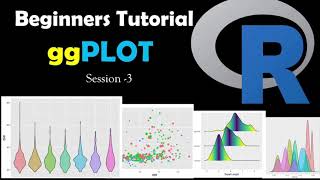
Graph ggPLOT Beginner Tutorial - Creating Simple Graphs in R
Learn to create simple graphs using ggplot2 in R, enhancing your data visualization skills for effective analysis and presentation.
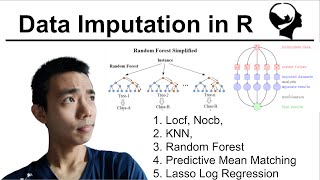
Dealing with Missing Data in R
Learn techniques for handling missing data in R, including various imputation methods, using packages like mice, and evaluating algorithm performance with ggplot2.
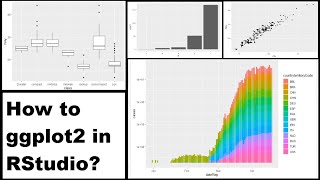
How to Use Ggplot2 in R - A Beginner's RStudio Tutorial
Learn to create data visualizations in R using ggplot2, from basic plots to advanced techniques. Covers installation, data understanding, and various plot types for effective data representation.
Introduction to Data Visualization with ggplot2
Learn to create powerful data visualizations using R's ggplot2 package. Master customization, choose optimal charts, leverage segmentation, and export high-quality graphics for analysis and presentations.

Intro to Data Visualization with R and ggplot2
Learn to create powerful data visualizations using R and ggplot2. Master customization, choose optimal charts, leverage segmentation, and export high-quality graphics for impactful data analysis and presentation.
Intro to R Visualizations in Microsoft Power BI - R Visualizations in Power BI
Learn to create dynamic R visualizations in Power BI, enhancing data exploration and analysis capabilities. Hands-on introduction covers ggplot2, data preprocessing, and integrating R with Power BI's interface and controls.
50 Ways to Show Your Data
Explore advanced data visualization techniques using R's ggplot2 package. Learn to create compelling diagrams beyond basic plots, including waterfalls, violins, and maps, with minimal code effort.