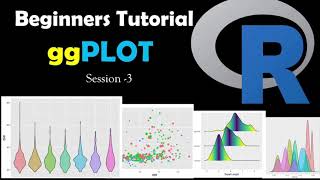
Graph ggPLOT Beginner Tutorial - Creating Simple Graphs in R
Learn to create simple graphs using ggplot2 in R, enhancing your data visualization skills for effective analysis and presentation.
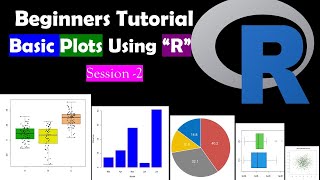
Creating Simple Graphs in R Studio - Bar, Scatter, and Box Plots
Learn to create bar graphs, scatter plots, pie charts, and box plots using simple R functions for effective data visualization in RStudio.
Tools and Techniques - Data Science with R - Dr. James Geddes
Explore data science techniques using R with Dr James Geddes. Learn practical skills for analyzing and visualizing data from an expert at the Alan Turing Institute.

Democratizing AI with Sparklyr
Learn to leverage Sparklyr for scalable machine learning and AI applications, empowering data scientists to work efficiently with big data in R.
Data Manipulation with Dplyr
Learn efficient data manipulation using dplyr in R. Master essential functions for filtering, aggregating, and joining datasets, enhancing your data analysis skills with practical examples.

N-Grams - Introduction to Text Analytics with R
Explore N-grams in text analytics, including TF-IDF validation, word ordering, dimensionality challenges, and hardware limitations. Enhance your R-based text analysis skills.

TF-IDF - Introduction to Text Analytics with R
Explore TF-IDF for text analytics in R: improve document representation, handle unequal lengths and common terms, implement TF-IDF, and clean data matrices post-weighting.
Intro to Machine Learning with R & Caret
Learn to leverage R's caret package for efficient machine learning tasks, including data sampling, model training, cross-validation, and hyperparameter tuning. Enhance your data science skills with practical examples.
Demystifying Conda and Virtual Environments for Bioinformatics
Comprehensive guide to Conda and virtual environments, covering installation, package management, and environment creation for Python and R projects. Includes practical demonstrations and comparisons between different tools.
Statistics with R Programming Language - Step by Step
Learn statistical concepts and their implementation in R programming. Step-by-step tutorials cover introductory to intermediate topics, with hands-on practice using downloadable datasets and scripts for a comprehensive learning experience.
Linear Regression Concept and with R Video Series
Comprehensive video series on linear regression concepts and R implementation, covering simple and multiple regression, assumptions, interactions, and model selection techniques.
Bootstrapping Statistics and Bootstrapping in R
Learn bootstrapping in statistics and R, covering resampling techniques, hypothesis testing, and confidence intervals. Gain practical skills with examples and downloadable datasets.
Analysis of Variance - ANOVA Statistics and ANOVA with R
Learn to perform Analysis of Variance (ANOVA) with practical examples and R implementation. Master statistical techniques for comparing multiple group means, including post-hoc tests and non-parametric alternatives.
Descriptive Statistics Concept and With R
Learn descriptive statistics techniques and their implementation in R, covering data summarization, visualization, and basic measures to effectively analyze and present research findings.
Bivariate Analysis in Statistics and with R - Statistics for Beginners
Comprehensive exploration of bivariate analysis techniques in statistics using R, covering various tests and methods for analyzing relationships between two variables.
Univariate Analysis in Statistics and with R - Statistics for Beginners
Comprehensive introduction to univariate analysis in statistics, covering key concepts like t-distribution, hypothesis testing, and confidence intervals. Includes practical examples using R for data analysis and visualization.

Getting Started with R - R Statistical Software Tutorial Videos
Comprehensive introduction to R programming for beginners, covering installation, basic operations, data handling, and essential functions. Ideal for those starting their journey in data analysis and statistics.
Graphs and Descriptive Statistics with R - R Statistical Software Tutorial Videos
Learn to create various graphs and calculate descriptive statistics using R. Master bar charts, boxplots, histograms, scatterplots, and more while customizing plots and adding text and legends.
Linear Regression in R
Comprehensive guide to linear regression in R: model fitting, assumption checking, interpretation, categorical variables, interactions, and advanced techniques for effective data analysis.
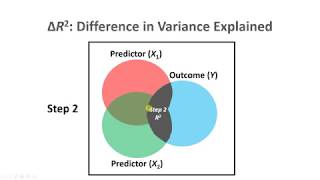
Conceptual Overviews of Statistical and Data-Analytic Tools and Techniques
Explore key statistical and data analysis methods, from hierarchical regression to survival analysis, with conceptual overviews of advanced techniques and tools.
Survival Analysis with TCGA Data in R - Create Kaplan-Meier Curves
Learn survival analysis using TCGA data in R, including Kaplan-Meier curves. Covers key concepts, data preparation, and practical implementation using survival and survminer packages.