Revolutionizing Continuous Deployment: How Databricks Integrates ArgoRollouts for Zero-Downtime Releases
Explore how Databricks achieves zero-downtime releases using ArgoRollouts, integrating with Jenkins, Spinnaker, and Prometheus for efficient, safe, and flexible continuous deployment across multiple clouds and regions.
From Legacy to GitOps - Transforming Government IT Infrastructure
Explore the transition from traditional sys-ops to GitOps in Kubernetes environments, covering deployment strategies, IaC, and real-world implementation in Spanish government ministries.
Making Sense of Your Vital Signals: The Future of Pod and Container Monitoring
Explore the future of pod and container monitoring in Kubernetes, from cgroups to Prometheus metrics. Learn about ongoing efforts to improve performance and enable new features for better cluster control.
Kubernetes Defensive Monitoring with Prometheus
Explore innovative uses of Prometheus for defensive monitoring in Kubernetes, complementing traditional security tools. Learn practical examples and ready-to-use strategies for enhancing your cluster's security posture.
Making Legacy Modern: Monitoring and Fine-Tuning Windows Cluster Performance
Optimize Windows clusters with new open-source tool for monitoring, alerting, and proactive performance tuning. Learn installation via HostProcess containers, Prometheus monitoring, and avoiding common pitfalls in workload scenarios.
Effortless Open Source Observability with Cilium, Prometheus and Grafana
Discover how Cilium leverages eBPF to provide seamless observability for applications using Prometheus metrics, without code modifications. Learn to monitor service connectivity and collect tracing data with open-source tools.
Jaeger: The Future with OpenTelemetry and Metrics
Explore Jaeger's evolution with OpenTelemetry, including trace-derived metrics, operational monitoring, and the new Prometheus-powered UI. Learn best practices for scalable trace pipelines and auto-instrumentation.
Cortex - Running a Rock Solid Multi-Tenant Prometheus
Explore resilience strategies for Cortex, a scalable multi-tenant storage solution for Prometheus. Learn about hash-ring replication, zone-aware replication, tenant limits, instance limits, and shuffle sharding.
ArgoCD as the Engine for Brownfield Migration to Kubernetes
Learn how a small team used ArgoCD to migrate to Kubernetes, integrating CNCF products like Istio, Helm, and Prometheus. Discover strategies, pitfalls, and resources for successful implementation and developer self-service.

How to Build a Distributed System and Should You - Lessons from Production
Explore the journey of building an eventually consistent system, including challenges, tools used, and lessons learned. Gain insights into distributed systems concepts and evaluate if building your own is right for you.
Calico Open Source Integration with Prometheus for Observability
Explore Calico Open Source's integration with Prometheus for enhanced network observability in Kubernetes environments.

Inside Prometheus - A Documentary Film
Explore the history, impact, and inner workings of Prometheus, the popular open-source monitoring system, through interviews with key contributors and users.
Accelerate Kubernetes Monitoring Adoption Using Krius - A CLI Tool for Multi-Cluster Setup
Streamline multi-cluster Prometheus and Thanos setup with Krius CLI, enabling efficient monitoring and management at scale for Kubernetes environments.
Operating High Traffic Websites on Kubernetes
Explore strategies for managing high-traffic websites on Kubernetes, focusing on scalability, performance optimization, and best practices for cloud-native infrastructure.

What's New in the Prometheus Ecosystem
Explore recent developments and advancements in the Prometheus ecosystem, focusing on monitoring and observability tools for cloud-native environments.
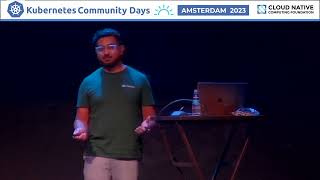
Operating High Traffic Websites on Kubernetes - Architecting for Scale and Efficiency
Learn to architect Kubernetes clusters for high-traffic websites, configure ingress controllers, and implement auto-scaling using Prometheus metrics and KEDA for efficient workload management.

BumbleBee - How to Start Using eBPF in Kubernetes
Explore eBPF technology, its landscape, and practical implementation in Kubernetes. Learn to use existing tools and expose outputs as Prometheus metrics with minimal effort.
Kubernetes Reloaded - Avoiding the Dev Plateau with Custom Resource Definitions
Explore Custom Resource Definitions (CRDs) in Kubernetes, their inner workings, and how they drive innovation. Learn about popular CRDs and see a demo of Kubernetes as an internal dev solution for platform engineering.
Cost-Efficient Multi-Cluster Monitoring with Prometheus, Grafana and Linkerd
Learn to build a cost-efficient, decentralized monitoring solution for multi-cluster environments using Prometheus, Grafana, and Linkerd's service mirroring capability.
Prometheus Updates and Deep Dive
Explore Prometheus, the cloud-native metrics monitoring standard. Learn its basics, internal workings, recent features, and future developments. Discover usage opportunities and potential ways to contribute.
Extending Observability to the Application Lifecycle with ArgoCD, Flux and Keptn
Enhance GitOps observability with Keptn: end-to-end traceability, deployment metrics, and lifecycle hooks for improved application management in Kubernetes environments.