Evolving Prometheus for More Use Cases
Explore Prometheus' evolution to meet modern cloud-native demands, including multi-cluster setups, eBPF, and edge services. Learn about advanced features and upcoming functionality for diverse use cases.
Building Prometheus Metrics Support in OpenTelemetry
Explore OpenTelemetry's metrics pipeline development, focusing on Prometheus compatibility, data models, and enhancements to ensure full interoperability in cloud-native observability.
Thanos - Highly Available, Pluggable, Long Term Metric Storage for Everyone
Explore Thanos: a scalable, highly available solution for long-term metric storage, enhancing Prometheus capabilities with multi-cluster telemetry, remote writes, and multi-tenancy features.
Stream vs. Batch - Leveraging M3 and Thanos for Real-Time Aggregation
Explore real-time aggregation approaches in M3 and Thanos for efficient monitoring of high-volume data in cloud-native applications, comparing stream and batch processing methodologies.
TSDB Data Compactions on Scale Without Headache - Now & Future
Explore TSDB data compaction techniques, challenges, and future improvements in Prometheus-based systems for enhanced query performance and storage efficiency.
Streaming Recording Rules for Prometheus, Thanos, and Cortex Using the M3 Coordinator
Explore streaming recording rules for efficient metrics aggregation in Prometheus ecosystems. Learn deployment options and techniques for fast aggregate views and downsampling in large-scale container environments.
Auto-instrumentation of Prometheus for RED Monitoring with eBPF
Explore auto-instrumentation of Prometheus for RED monitoring using eBPF, enabling uniform data collection across diverse workloads without manual instrumentation or service mesh complexity.
Deep Network Traffic Observability with Pktvisor and Prometheus
Explore deep network traffic observability using Pktvisor and Prometheus. Learn installation, configuration, metrics collection, and visualization techniques for efficient network analysis and management.
Telemetry is Not Having to Hope
Explore the evolution of telemetry in software, its role in managing complexity, and how Prometheus simplifies monitoring for technical and organizational benefits.
Practical Kubernetes Monitoring with Prometheus
Learn practical Kubernetes monitoring using Prometheus, covering setup, service discovery, alerting, and advanced topics like SLOs and security. Gain insights into best practices and real-world applications on GitLab.com.
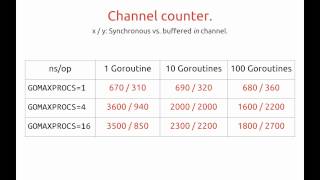
Prometheus - Designing and Implementing a Modern Monitoring Solution
Explore the design and implementation of Prometheus, a modern monitoring solution, from instrumentation to storage backend, based on lessons learned during its development at SoundCloud.

How to Build a Distributed System - and Should You?
Explore building an eventually consistent distributed system using Go, gRPC, Kubernetes, LevelDB, and Prometheus. Learn key concepts, implementation challenges, and lessons from real-world deployment across multiple countries.

Measure PromQL and MetricsQL Expression Complexity
Explore PromQL/MetricsQL query optimization techniques, including data models, time series analysis, and performance improvement strategies for efficient observability in complex systems.
Power Efficiency Aware Kubernetes Scheduler (PEAKS)
Explore PEAKS, a sustainable Kubernetes scheduler leveraging Kepler for power-efficient pod allocation, addressing underutilization and reducing carbon footprint.

How to Make Your AI Application Highly Scalable - Azure Cloud Deployment Guide
Comprehensive guide to deploying scalable AI applications on Azure Cloud, covering repository setup, containerization, CI/CD, Kubernetes deployment, load balancing, monitoring, and security.
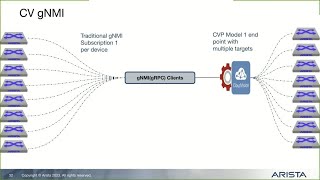
Streaming CloudVision Telemetry to External Sources Using gNMI
Discover how to stream CloudVision telemetry data to external platforms like Influx, Prometheus, and Grafana using gNMI interface for enhanced network monitoring and visualization.
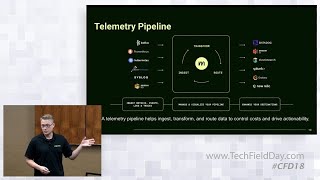
Understand and Optimize Logs, Metrics, Traces, and Events with the Mezmo Telemetry Pipeline
Master telemetry data optimization techniques for DevOps and SREs, covering data profiling, signal isolation, and dynamic pipelines to enhance observability platform performance and reduce costs.
10 Kubernetes Security Mistakes to Avoid
Discover critical security vulnerabilities in Kubernetes deployments and learn practical fixes for common misconfigurations, based on real-world data analysis from 10K+ clusters.
Modern Application Debugging: An Introduction to OpenTelemetry - DevOpsDays NYC 2023
Explore OpenTelemetry for modern application debugging. Learn to instrument microservices, collect metrics, traces, and logs, and analyze telemetry signals using open-source tools like Jaeger and Prometheus.
Developer-Ready Platform Microservice Template - Benefits and Implementation
Explore a low-code framework for microservices in cloud-native platforms. Learn how it boosts productivity, reduces costs, and simplifies complex technologies for developers.
Crafting and Leveraging Prometheus Metrics for Infrastructure Intelligence
Explore Prometheus metrics for data-driven infrastructure decisions. Learn query-building, tools, and data warehouse concepts to maximize insights from your system's metrics.