Creating a Custom Serving Runtime in KServe ModelMesh - Hands-On Experience
Learn to create custom serving runtimes in KServe ModelMesh for ML model deployment. Explore key features, build container images, and run predictions using custom runtimes in this hands-on tutorial.
Kubernetes and Other CNCF Projects Overview
Comprehensive overview of Kubernetes and other CNCF projects, exploring their features, benefits, and integration in cloud-native ecosystems for enhanced containerization and orchestration.

High Available and Scalable Prometheus with Thanos in Alibaba
Explore Alibaba's approach to high-availability and scalable monitoring using Prometheus and Thanos, supporting 4 million TPS and 10K requests per second in large-scale e-commerce environments.
Exploring High Availability in Kubernetes with Vitess
Learn how Vitess enhances high availability in Kubernetes, featuring failure handling, data recovery, and integration with monitoring tools. Includes a live demo on disaster preparedness and recovery.
Service Mush - Debugging Istio Deployments
Practical guide to troubleshooting Istio deployments, covering traffic management, telemetry issues, and essential debugging tools for microservices environments.
Out-of-the-Box Observability and Tracing in Kubernetes with Kong, Zipkin and Prometheus
Learn to collect and visualize observability metrics in Kubernetes using Kong, Zipkin, and Prometheus for improved service reliability and performance monitoring.
Managing Large-Scale Kubernetes Clusters Effectively and Reliably
Learn strategies for managing large-scale Kubernetes clusters across global data centers, including automated node lifecycle management, cluster deployment, upgrading, and risk prevention using Prometheus and Operator.
How to Send Alerts in Prometheus Using Alertmanager
Learn to set up Alertmanager with Prometheus, configure alerting rules, and send customized alerts for effective system monitoring. Covers installation, configuration, and practical examples of alert creation.
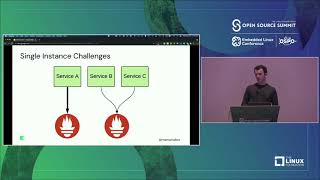
Long-Term Metrics with M3 and Prometheus
Explore M3 and Prometheus for efficient long-term metric storage, high availability, and data rebalancing in large-scale systems.
Open Source for Better Observability
Explore cloud-native observability using open-source tools like Prometheus, Elastic Search, and Jaeger. Learn about metrics, logging, and telemetry for better system monitoring and troubleshooting.
OpenTracing: Beyond Distributed Tracing - Video 2
Explore OpenTracing's role in microservices monitoring, its connection to logging and metrics, and its practical applications through a demo involving distributed traces and Prometheus monitoring.
Intro to Docker - From Development to Production and Prometheus Monitoring
Explore Docker's development lifecycle, cloud-native app deployment on Docker Swarm, and Prometheus monitoring. Learn from Codeship and Weaveworks' experiences in containerization and observability.

Monitoring with Prometheus for Docker Environments
Explore Prometheus: an opinionated metrics and monitoring system for modern workloads. Learn its design principles, architecture, and application in Docker environments through demos and practical insights.
Monitoring: A New Approach
Explore modern monitoring techniques, time series databases, and visualization tools for efficient system oversight. Learn about MonitRD, Nagios Core, and Prometheus for enhanced IT infrastructure management.
Prometheus-Enabled AI Deep Observability Based on eBPF
Explore AI deep observability using Prometheus and eBPF, covering eBPF architecture, Prometheus monitoring, and deploying eBPF tasks in containers for kernel metric detection.
Federated Monitoring Leveraging Open Source Technologies
Explore federated monitoring using open-source tools, focusing on Kubernetes observability, Grafana integration, and Cortex for scalable metrics storage and querying.
Comprehensive Observability of Microservices Using Deep Linked Metrics and Traces
Explore deep-linked metrics and traces for comprehensive microservices observability, enhancing on-call experiences and enabling automatic issue detection and resolution.
Instrumenting Applications and Alerting with Prometheus
Learn to instrument applications and set up effective alerting using Prometheus. Gain real-time visibility, detect problems quickly, and create observable systems through practical demonstrations and best practices.
Lessons Learned from Running Prometheus
Explore Prometheus operations, architecture, and best practices. Learn about memory usage, scalability, and Kubernetes integration for effective monitoring and alerting.
Journey from Fluent Bit, Fluentd and Prometheus to OpenTelemetry Collector - Lessons Learned
Explore the transition from multiple telemetry tools to OpenTelemetry Collector, discussing challenges, performance improvements, and simplification of data collection in cloud-native environments.
How Prometheus Halved Its Memory Usage
Discover how Prometheus significantly reduced its memory usage, enabling efficient monitoring of millions of metrics. Learn about data structures, profiling, and impacts on related projects.