Demo of Kubernetes at the Edge for AI Model Deployments
Explore AI model deployment at the edge using Kubernetes, addressing challenges in distributed architectures, data management, and disconnected deployments through a live demo with MLOps pipelines and OpenTelemetry.
Building AI-Ready Platforms - Symphony for Developers and Platform Engineers
Explore adapting platforms for AI applications, focusing on LLM integration, golden paths, and production-grade capabilities. Learn to build an AI-ready platform and implement a composer AI assistant.
Prometheus Update from the Maintainers
Discover the latest Prometheus updates, including improved performance, OpenTelemetry integration, and native histograms. Learn about future plans and version 3.0 from project maintainers.
A Hitchhiker's Guide to Observing Java Applications in Kubernetes
Explore Kubernetes observability tools, from API-querying UIs to service meshes and application monitoring, to understand cluster health and performance.
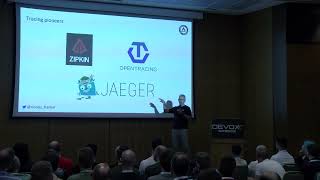
Practical Introduction to OpenTelemetry Tracing for Developers
Explore OpenTelemetry tracing for distributed systems, focusing on its importance, compatibility with existing tools, and practical implementation in microservices architectures.
Traceability and Observability in Multi-Step LLM Systems - LLMOps
Explore advanced techniques for implementing traceability and observability in multi-step LLM systems, focusing on RAG systems and leveraging OpenTelemetry for deep insights.
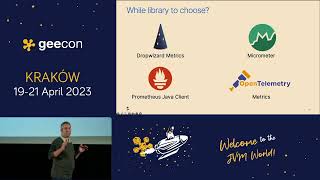
OpenTelemetry Metrics: Observability's Holy Grail
Explore OpenTelemetry Metrics' revolutionary impact on microservices and libraries, understanding its benefits, concepts, and API/SDK entities for improved observability.
Tracing for Java Developers - Hands-on Overview and Implementation
Explore hands-on tracing and APM for Java applications. Learn implementation, benefits, and OpenTracing concepts using Elastic APM and Jaeger agents.
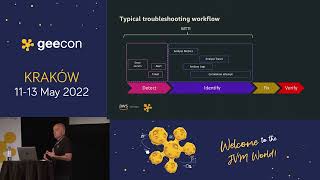
Modern Observability for Cloud Applications - Spectacles on Steroids
Explore modern telemetry for cloud-based distributed systems, covering observability pillars, AWS services, OSS integration, and reference architectures for enhanced monitoring.
Reducing Costs in Distributed Tracing: Strategies for Efficient Observability
Optimize distributed tracing costs while maintaining effectiveness. Learn span tweaking, custom sampling, and OpenTelemetry techniques to balance observability and expenses in cloud environments.
OpenTelemetry Metrics 101
Demystifying OpenTelemetry metrics: Learn about different metric instruments, their implementation, and how they can enhance your understanding of system performance and error rates.

Building an APM with OpenTelemetry and OpenSource
Explore building an open-source APM using OpenTelemetry, Prometheus, and Jaeger. Learn implementation strategies, risks, and upcoming improvements in the OTel community for cost-effective application performance monitoring.
OpenTelemetry - Overview & Backwards Compatibility of OpenTracing + OpenCensus
Explore OpenTelemetry's goals, structure, and roadmap, including its merger of OpenCensus and OpenTracing, and learn about backwards compatibility and instrumentation.
Distributed Tracing in .NET 6 using OpenTelemetry
Explore distributed tracing in .NET 6 using OpenTelemetry, covering observability, implementation, and visualization with Jaeger and Honeycomb.io for effective microservices monitoring.
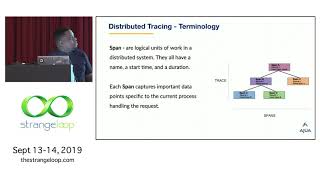
Everything You Wanted to Know About Distributed Tracing
Explore distributed tracing in microservices: concepts, implementation patterns, and troubleshooting techniques. Learn about OpenTelemetry and its benefits for modern, polyglot environments.
Application Diagnostics in .NET Core 3.1
Explore advanced techniques for diagnosing and resolving issues in .NET Core 3.1 applications, including new APIs, command-line tools, and Visual Studio features for efficient troubleshooting and performance optimization.
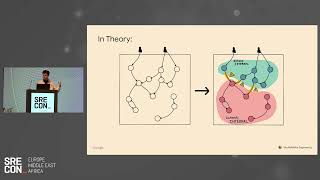
Hunting for Risky Dependencies in the World of Microservices
Discover how to identify and mitigate hidden vulnerabilities in microservice architectures using OpenTelemetry, with real-world examples from Google Maps' high-risk dependencies.

Tracing Bare Metal with OpenTelemetry
Explore how Equinix Metal implemented OpenTelemetry tracing for bare metal provisioning, improving debugging and reliability across their global infrastructure.
Take Me Down to the Paradise City Where the Metric Is Green and Traces Are Pretty
Explore OpenTelemetry for cloud-native observability, including its APIs and SDKs. Learn how to implement traces and metrics in Java and Go, with practical examples and insights on framework stability.
O-1, O-n and O-
Learn to identify and fix common performance issues in your code using OpenTelemetry tools, and implement automated performance testing for long-term optimization.
Exporting Your Trace Telemetry with OpenTelemetry and Fluent Bit
Learn to collect and export trace telemetry using OpenTelemetry and Fluent Bit for efficient cloud-native application monitoring and observability.