Extending OpenTelemetry to Observability
Explore OpenTelemetry's role in observability, learn how to enhance it with automation and AI for faster problem resolution in complex environments through a real-world case study and demo.
Log Support in OpenTelemetry
Explore OpenTelemetry's log support, including data model, implementation in Java, collector support, and future plans. Learn about instrumentation libraries and log collection.
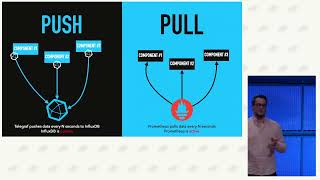
Modern Observability - Scalable Observability with the LGTM Stack - Harnessing the Power of Loki, Grafana, Tempo, and Mimir
Explore advanced observability using the LGTM stack (Loki, Grafana, Tempo, Mimir). Learn how it integrates with OpenTelemetry to enhance monitoring and tracing for high-performance systems.

Better Observability with No Code Changes
Discover techniques for enhancing application observability without modifying code. Learn to identify key functions for instrumentation and use OpenTelemetry's Javaagent for configuration-based runtime visibility.
Message Processing Failed! But What's the Root Cause?
Explore techniques for investigating failures in distributed systems, including modeling, integration testing, and OpenTelemetry instrumentation to enhance system observability.
Observability Driven Development
Explore techniques for developing applications with enhanced observability, focusing on searchable, consistent, and rich log messages to improve production debugging and customer support.
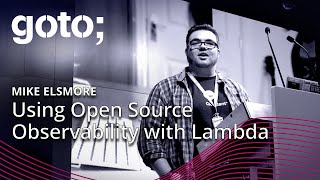
Using Open Source Observability with Lambda
Explore open-source observability tools for AWS Lambda, covering logging, metrics, and tracing. Learn to implement and benefit from these tools for enhanced system monitoring and troubleshooting.

From k9s to OpenTelemetry - A Guide to Observability for Your Apps in K8s
Explore Kubernetes observability tools, from simple API queries to advanced application monitoring, to effectively manage and monitor your cluster workloads and applications.
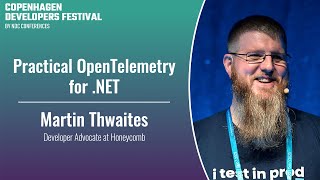
Practical OpenTelemetry for .NET
Explore OpenTelemetry implementation in .NET, covering tracing, metrics, and logs. Learn practical tips and potential pitfalls for efficient telemetry data export from your applications.
Monitoring Digital Experience to Determine Feature Effectiveness
Discover how to quantify user experience and feature adoption in internal applications using real user monitoring (RUM) metrics, Elastic RUM agent, and OpenTelemetry for Node.js.
OpenTelemetry and Continuous Feedback - Things You Need to Know About Your Java Code at Runtime
Explore OpenTelemetry for Java runtime insights, gaining valuable continuous feedback to enhance code performance and troubleshoot issues effectively.
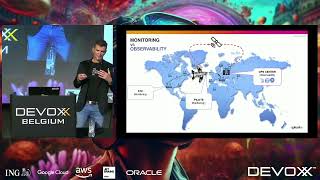
Java Observability with OpenTelemetry
Explore Java observability using OpenTelemetry, enhancing application monitoring and performance analysis for improved system reliability and troubleshooting capabilities.
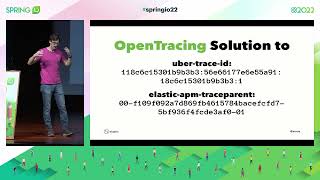
Bootiful OpenTelemetry
Explore OpenTelemetry integration with Spring Boot for enhanced observability. Learn about auto-instrumentation, tracing, metrics, and logging to uncover performance issues and errors effectively.
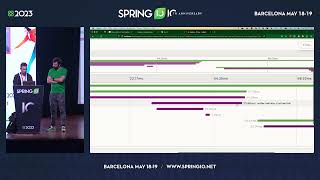
Observability of Your Application
Explore application observability using distributed tracing, metrics, and correlated logs. Learn to troubleshoot issues, analyze performance, and visualize latency with Spring and various observability tools.
Continuous Code Feedback with OpenTelemetry and Digma
Explore OpenTelemetry and Digma for real-time code insights, enhancing development efficiency and software quality through continuous feedback mechanisms.
CHARLAS - Tracing Distribuido con OpenTelemetry
Explora el tracing distribuido con OpenTelemetry: conceptos, instrumentación automática y demostración práctica para monitorear sistemas distribuidos eficientemente.
How to Monitor and Troubleshoot Applications Using OpenTelemetry
Explore OpenTelemetry for efficient application monitoring and troubleshooting. Learn to detect issues, track performance, and enhance observability in cloud-based environments using this open-source protocol.
How to Troubleshoot and Monitor Applications Using OpenTelemetry
Learn to instrument, monitor, and troubleshoot Python applications using OpenTelemetry. Gain hands-on experience with traces, metrics, and logs for improved observability and faster issue resolution.
Migrating to OpenTelemetry From a Custom Distributed Tracing Pipeline
Discover Shopify's journey migrating to OpenTelemetry, exploring motivations, advantages, and implementation details for improved distributed tracing in cloud-native environments.
Observability at Scale - Running OpenTelemetry Across an Enterprise
Explore Intuit's journey in implementing large-scale observability using OpenTelemetry, Kubernetes, and Jaeger. Learn about scaling ElasticSearch, secure agent onboarding, and leveraging open-source libraries for enhanced trace data.

Jaeger Deep Dive
Explore Jaeger's architecture, features, and roadmap. Learn about adaptive sampling, multi-tenancy, and deployment strategies for this distributed tracing platform.