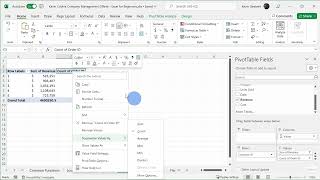
Excel Pivot Tables Tutorial - Lesson 9-1
Master pivot tables in Excel through hands-on demonstrations and practical techniques for analyzing, summarizing, and presenting complex data effectively.

Enhancing Excel Skills with ChatGPT - Excel Functions and Macros Tutorial
Master Excel functions, nested formulas, and macros using ChatGPT's AI capabilities to automate calculations, streamline data analysis, and enhance productivity through practical, step-by-step examples.
How to Create Pivot Tables from Multiple Excel Worksheets
Master the process of combining and analyzing data from multiple Excel sheets using Power Query and pivot tables to create powerful data summaries and insights.

Microsoft Excel Fundamentals - From Basics to Pivot Tables
Master essential Excel skills from basic data entry to advanced features like pivot tables, formulas, and collaborative tools for improved data analysis and spreadsheet management.

How to Insert and Use Checkboxes in Microsoft Excel
Master the art of adding interactive checkboxes in Excel, from basic insertion to advanced functionality with formulas, conditional formatting, and filters for dynamic task tracking and data management.
Creating and Customizing Pivot Charts in Excel - From Data Preparation to Advanced Filtering
Master the creation and customization of pivot charts in Excel to transform complex data into dynamic visualizations. Learn data formatting, chart manipulation, and filtering techniques for effective data analysis.

Creating Bar Charts and Column Charts in Microsoft Excel - Data Visualization Tutorial
Master the creation and customization of Excel bar charts, from basic column layouts to stacked variations, while learning essential formatting techniques and shortcuts for professional data visualization.

How to Add and Use Checkboxes in Excel - From Basic Controls to Dynamic Charts
Master the art of creating interactive Excel worksheets with checkboxes, from basic implementation to advanced features like dynamic charts, filtering, and conditional formulas.
Microsoft Excel Copilot - Features, Capabilities, and Analysis
Explore how Copilot enhances Excel workflows through AI-powered data analysis, formula generation, and visualization tools, evaluating its practical benefits and limitations.

Create Dependent Drop-down Lists in Excel - Easy Method
Master the creation of dependent dropdown lists in Excel for dynamic forms, using named ranges and INDIRECT functions to build interconnected selection menus for efficient data organization.

Microsoft Copilot: A Comprehensive Guide to AI-Powered Productivity in Windows and Microsoft 365
Master Microsoft's AI assistant across Windows and Microsoft 365 apps, from generating text and images to managing emails, creating presentations, and analyzing data - all through hands-on demonstrations and practical examples.

Creating and Formatting Charts in Microsoft Excel - A Complete Tutorial
Master data visualization techniques in Excel through hands-on practice with charts, from basic line and pie charts to advanced pivot charts and sparklines, including formatting and design tips.

Getting Started with Python in Microsoft Excel - A Beginner's Tutorial
Discover how to leverage Python's powerful data analysis and visualization capabilities directly within Microsoft Excel, from basic syntax to advanced libraries like Pandas and Matplotlib.
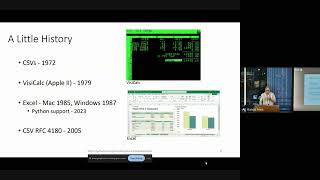
Spreadsheet Does What?! - Working with Spreadsheets in Python
Explore the intricacies of Python-based spreadsheet handling, from historical developments to common challenges and practical solutions for effective data management.
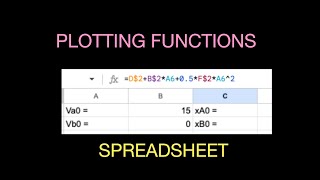
Calculating and Plotting Mathematical Functions with a Spreadsheet - Intro Tutorial
Learn to harness spreadsheet power for plotting equations efficiently. Master quick techniques to visualize mathematical functions graphically.
Creating PivotTables and PivotCharts Dashboards with Slicers in Excel
Learn to create interactive Excel dashboards using PivotTables, PivotCharts, and Slicers. Master data visualization techniques, customize slicer appearance, and integrate timeline slicers for date-based filtering.
The Excel Help Tab and Ribbon in Depth
Explore Excel's Help Tab and Ribbon for comprehensive support, training resources, and community connections. Enhance your skills and stay updated on the latest Excel features.
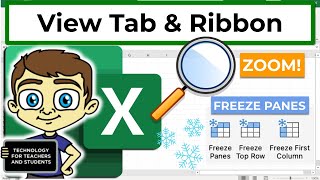
Excel View Tab and Ribbon in Depth
Explore Excel's View tab features like zoom, freeze panes, and Page Break Preview to enhance productivity and streamline your workflow in this comprehensive tutorial.
Excel 365 for Beginners - Navigating Workbooks and Ribbons - Lecture 5
Learn to navigate Excel 365's interface, create workbooks, and understand key elements like ribbons, tabs, and toolbars. Master the basics of Excel's structure for efficient spreadsheet management.
How to Use the PMT Function to Calculate Loan Repayments in Excel
Learn to calculate loan repayments using Excel's PMT function. Master What-If Analysis tools, build amortization schedules, and enhance financial analysis skills for efficient loan management.
Excel 365 for Beginners - AutoFill and Flash Fill Techniques - Lecture 21
Explore AutoFill options and Flash Fill in Excel 365 to automate data entry, recognize patterns, and boost productivity. Learn time-saving techniques for efficient spreadsheet management.