excelisfun
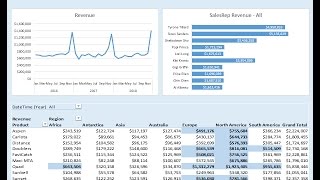
How to Build Excel Dashboard - PivotTable, Chart, Conditional Formatting
3 reviews
Learn to create an Excel dashboard using Power Query, PivotTables, charts, and DAX measures. Master data modeling, conditional formatting, and dynamic updates for effective data visualization and analysis.
YouTube36 minutesВ любое времяБесплатное видео

Charming Data
Connecting Plotly Graphs to Dash Components
Learn to create interactive data visualizations by connecting Plotly graphs with Dash components. Master various chart types and enhance user interaction in your Python-based dashboards.
YouTube4 hours 30 minutesВ любое времяБесплатное видео

Simon Sez IT
How to Build Interactive Excel Dashboards
Learn to create interactive Excel dashboards for effective data visualization. Master calculations, charts, graphs, and formatting techniques to design impactful dashboards. Includes practical exercises and downloadable files for hands-on learning.
YouTube40 minutesВ любое времяБесплатное видео