Running Total in Column - Power Query, DAX or Worksheet Formula?
Learn to create running totals in Excel using worksheet formulas, Power Query, and DAX. Master expandable ranges and cumulative calculations for overall and monthly totals.
Two Fact Tables - DAX, Power Query or Worksheet Formulas to Convert to 1 Fact Table
Learn techniques to convert two fact tables into one using Excel formulas, DAX in Power Pivot, and Power Query in Power BI. Master data modeling and analysis skills for improved business reporting and decision-making.
Power Query - Reduce Data Model Size, Transformations to Columnar Database Size
Learn strategies to optimize data model size using Power Query transformations, enhancing efficiency for big data analysis and business intelligence with columnar databases.
Data Modeling - VLOOKUP, Power Query or Power Pivot?
Learn data modeling techniques using VLOOKUP, Power Query, and Power Pivot for efficient data analysis in Excel. Explore methods for handling multiple tables and creating effective PivotTable reports.
The Magic of Power Query to Import, Transform & Load Data
Learn to import, clean, and transform data using Power Query in Excel. Master techniques for efficient data handling, report creation, and automated updates.
Visualizing Data with Tables, Charts, Conditional Formatting & Dashboards
Learn to create effective data visualizations in Excel using tables, charts, conditional formatting, and dashboards. Master techniques for clear, impactful data presentation and analysis.
PivotTables & Slicers - Create Dashboards & Summary Reports
Master PivotTables, Slicers, and dashboards in Excel. Create cross-tab reports, frequency distributions, and custom calculations for effective data analysis and visualization.
Excel Spreadsheet Formulas - Old School or Dynamic Arrays?
Learn to use Excel formulas for data analysis, comparing traditional methods with dynamic arrays. Master SUMIFS, COUNTIFS, and AVERAGEIFS for creating effective summary reports.

Data, Proper Data Sets, Excel Tables, Logical Tests, More
Learn essential Excel skills for data analysis: proper data sets, tables, sorting, filtering, and logical tests. Master the basics of handling and extracting insights from raw data efficiently.
DAX Iterators, Table Functions, Grain, Cardinality, Materializing Tables Excel & Power BI
Comprehensive guide to DAX iterators and table functions in Excel Power Pivot and Power BI, covering advanced concepts like context transition, cardinality, and performance optimization.
Comprehensive Excel Dynamic Array Formula Lesson - The Power of Array Formulas
Explore Excel's new dynamic array formulas and functions, enhancing data analysis with spill ranges, UNIQUE, FILTER, SORT, and more. Master advanced techniques for efficient spreadsheet manipulation and reporting.
Mysteries of VLOOKUP Function Revealed - Amazing Examples
Comprehensive tutorial on VLOOKUP function in Excel, covering 15 examples from basic to advanced usage, including exact and approximate matches, dynamic tables, and error handling.
Power Query Complete M Code Introduction - Values, Let, Lookup, Functions, Parameters, More
Comprehensive introduction to M Code in Power Query, covering values, expressions, functions, and advanced techniques for efficient data manipulation and analysis.
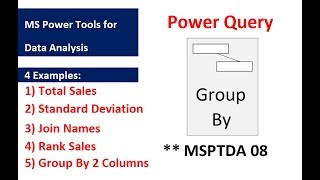
Power Query Group By Feature and Table.Group Function - Examples
Learn Power Query's Group By feature with five practical examples, including calculating totals, standard deviation, joining names, and ranking sales.
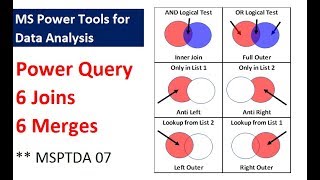
Power Query - 6 Types of Joins, 6 Types of Merges - 9 Examples
Explore Power Query's 6 types of joins and merges through 9 practical examples, enhancing your data analysis skills in Excel with step-by-step guidance.

Power Query - Excel.CurrentWorkbook Function to Append All Excel Tables in Excel Workbook
Master Excel's Power Query to efficiently append tables, handle recursion issues, and manipulate data using advanced functions like Excel.CurrentWorkbook and Table.ColumnNames.
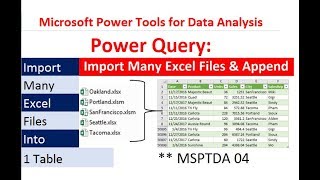
Power Query - Import Multiple Excel Files and Combine into Proper Data Set
Learn to import and combine multiple Excel files using Power Query, create a unified dataset, and build dynamic PivotTable reports with automated updates when new files are added.
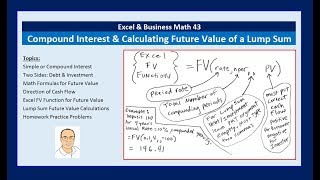
Excel and Business Math - Compound Interest Calculating Future Value of a Lump Sum FV Excel Function
Master compound interest calculations using Excel's FV function. Learn to compare simple and compound interest, analyze cash flow direction, and apply formulas for various investment scenarios.
Excel & Business Math - Simple Interest Calculations & Short Term Loans
Learn to calculate simple interest, solve for principal, rate, and time in Excel. Master essential formulas for short-term loans and financial calculations.
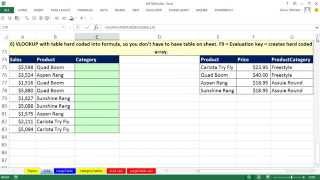
IF or VLOOKUP Function for Assigning Categories with Excel Formula - 8 Examples
Learn advanced Excel techniques for assigning categories using IF and VLOOKUP functions. Master data organization, formula creation, and efficient lookup methods for various scenarios.

Aging Accounts Receivable Reports on Multiple Sheets With Array Formula
Learn to create automated Aging Accounts Receivable Reports using Excel's array formulas, table features, and structured references. Master advanced functions like COUNTIFS, AGGREGATE, and INDEX for efficient data extraction and reporting.