What's Next for Business Analytics in the 21st Century
Experts discuss hot topics in business intelligence, analytics, and big data, providing insights on staying ahead in the evolving field of business analytics.
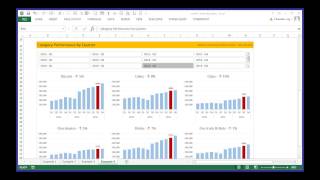
Productivity Revolution in Excel
Discover how to leverage Excel and Power BI for powerful business intelligence. Learn to create charts, dashboards, and formulas, and master data extraction, modeling, and visualization techniques.
3D Visualization and Storytelling with Power Map for Excel
Explore Power Map's 3D visualization capabilities in Excel for immersive geographic and temporal data discoveries. Learn to create cinematic tours for sharing geospatial insights across industries.
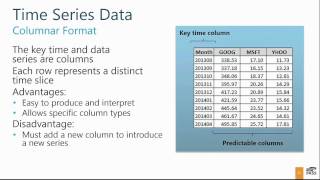
Introduction to Time Series Forecasting
Learn intuitive time series forecasting using Microsoft's algorithm in SQL Server Analysis Services. Explore data preparation, model creation, querying, and result interpretation through Visual Studio and Excel demonstrations.
Using Data to Make Decisions
Learn practical techniques for leveraging data to simplify complex decisions, from buying cars to choosing healthcare, using precision questions, machine learning, and common tools like Excel and T-SQL.
Bridging the Gap Between Decision Makers and Advanced Analytics
Explore embedding advanced analytics in decision support systems to bridge the gap between potential and actual business impact, enhancing value creation across organizations.
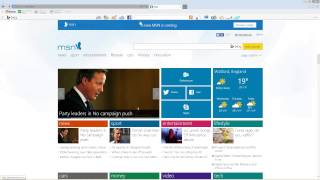
Business Intelligence Toolkit Overview - Microsoft Power BI and R
Explore data visualization with Power BI and R, focusing on cognitive psychology theory and practical applications for creating effective dashboards and analyses.
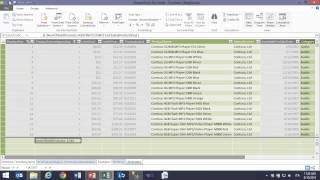
DAX Formulas in Action
Explore DAX formulas for BI solutions in Excel and SQL Server. Learn to create calculated columns, measures, and effective PivotTable analysis through hands-on demonstrations.
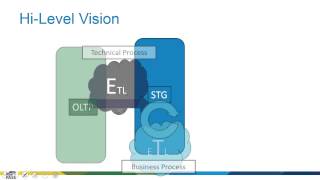
Agile Data Warehousing - Start to Finish
Learn agile data warehousing techniques to streamline production, maintenance, and evolution using SQL Server Data Platform, balancing cost-cutting and resource investment for optimal business value.
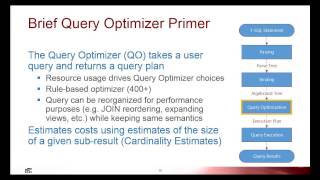
Changes to Query Plans
Explore SQL Server 2014's impact on query plans, focusing on statistics management for large tables and the redesigned cardinality estimator for improved plan costing and performance optimization.
Power BI Deep Dive
Explora las nuevas capacidades de Excel y Office 365 para Business Intelligence. Descubre, analiza y visualiza datos en Excel, y comparte tus hallazgos a través de Office 365.
Unlocking Data Insights
Empower users with robust BI tools to transform raw data into business insights. Learn to enable easy data access, leverage Microsoft's tools, and build a comprehensive data platform across on-premises, cloud, and devices.
Dark Matter - Domain Experts & Nextgen Spreadsheets Are Our Future
Unlocking organizational potential through domain expertise and advanced spreadsheets. Learn to leverage existing knowledge, improve data strategies, and turn Excel into a competitive advantage.
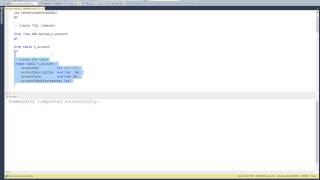
Columnstore Technical Deep Dive
Explore SQL Server 2014's updateable columnstore for massive query performance gains. Learn internals, differences from row store, and metadata insights in this technical deep dive.
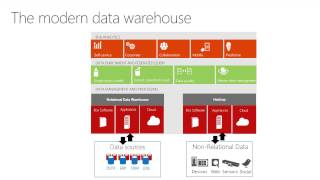
The Modern Data Warehouse
Explore Microsoft's approach to evolving data warehouse infrastructure, addressing explosive data growth and new data types. Learn about scale-out technologies, in-memory performance, and Hadoop integration.
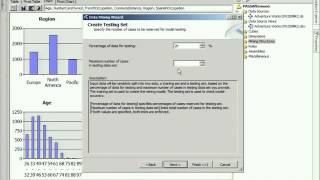
Introduction to Data Mining in SQL Server Analysis Services
Learn to create and integrate data mining models in SQL Server Analysis Services for customer prediction, marketing optimization, and forecasting using various algorithms and tools.
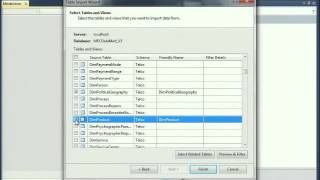
Developing and Managing a Business Intelligence Semantic Model in SQL Server Analysis Services
Learn to create, manage, and troubleshoot BI Semantic Models using SQL Server "Denali" features, with PowerPivot as a starting point for enhanced business intelligence capabilities.
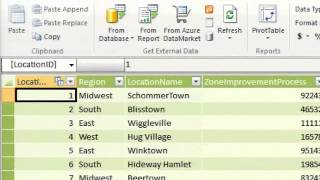
PowerPivot - A Cool Reporting Tool
Explore PowerPivot for Excel to combine diverse data sources, create analytics, and overcome Excel limitations. Learn to import, pivot, and visualize data for self-service business intelligence.
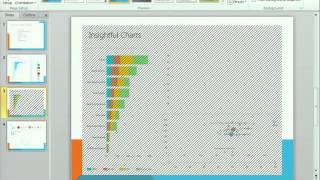
Reporting with Crescent - Your Organization's Got Talent
Become a Crescent hero and delight business users with beautiful, meaningful self-service reporting for your organization.
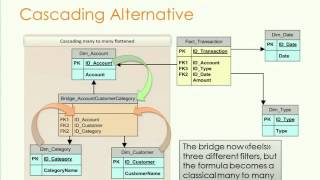
Many-to-Many Relationships in DAX
Explore advanced DAX techniques for handling many-to-many relationships in data modeling, with practical examples and insights into the Vertipaq engine's capabilities.

Swimming in the Data Lake
Explore data lake concepts, best practices, and tools for effective data management and analytics in modern cloud environments.