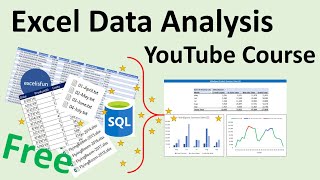
Excel Data Analysis Basics Class - Data Analysis & BI Made Easy with Excel Power Tools
Learn Excel data analysis using Power Tools: formulas, PivotTables, Power Query, Power Pivot, and Power BI. Create reports, dashboards, and visualizations for effective business decision-making with real-world datasets.
Power BI Training
Become an expert in Power BI, data and analytics reporting tool, through this tutorial series from Learnit training
Data Cleaning in Excel - Text Functions and Power Query
Learn essential data cleaning techniques in Excel using text functions and Power Query. Master importing, formatting, and manipulating data for accurate analysis and improved efficiency.
Business Analytics for Management Decision
This course will be exclusively quantitative and an application to business/management-related problems. It is connected with problem sets and real life cases to know the relevance of a particular problem and the decision-making thereof.
Power BI Crash Course for Beginners - Analyze & Visualize Data with Power BI Desktop
Learn to prepare, analyze, and visualize data using Microsoft Power BI Desktop. This beginner-friendly tutorial covers installation, data connection, query editing, and creating impactful visuals.

Advanced Analytics with Azure
Explore Azure's advanced analytics capabilities, including Databricks, SQL Data Warehouse, and BI tools. Learn data ingestion, performance tuning, security, and modern data warehouse concepts.
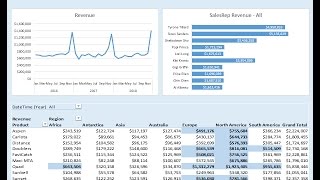
How to Build Excel Dashboard - PivotTable, Chart, Conditional Formatting
Learn to create an Excel dashboard using Power Query, PivotTables, charts, and DAX measures. Master data modeling, conditional formatting, and dynamic updates for effective data visualization and analysis.
Data Visualization Tutorial
Learn to create impactful visualizations using Python libraries and tools like Tableau and PowerBI. Hands-on demonstrations cover Matplotlib, Seaborn, and Plotly for effective data presentation and insights.
Power BI Desktop - Data Modeling & Interactive Visualizations
Learn data modeling and interactive visualization in Power BI Desktop. Import Excel files, build DAX formulas, create data models, and design interactive visualizations for effective data analysis and business intelligence.
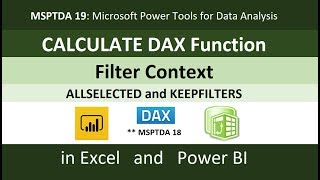
Calculate DAX Function and Filter Context - ALLSELECTED and KEEPFILTERS
Comprehensive tutorial on CALCULATE DAX function, filter context, and related concepts in Power BI and Excel Power Pivot. Covers 50 examples with in-depth explanations of advanced DAX techniques.
Excel Power Query - Power Query Tutorial for Beginners
Learn Power Query in Excel: import, transform, and combine data from multiple sources. Master essential techniques for efficient data analysis and manipulation.

Power BI Master Tutorial
Master data processing and visualization with Power BI. Learn to build queries, prep data, create relationships, and develop interactive dashboards. Gain skills in advanced analytics, AI visuals, and custom visualizations.

M Code Class from Basic to Advanced - Power Query Excel & Power BI, Custom Functions
Comprehensive tutorial on M Code in Power Query for Excel and Power BI, covering basics to advanced topics like custom functions, data types, and lookups. Ideal for mastering data manipulation.

Qlik Sense Tutorial - Beginner to Advanced Training
Comprehensive Qlik Sense training covering basics to advanced topics. Learn data loading, visualization creation, app publishing, variables, dynamic loading, scripting, and more. Ideal for beginners and experienced users.

Tableau for Beginners in Hindi - Tableau Training for Beginners - Tableau Tutorial
Great Learning brings you this video “Tableau in Hindi”, aimed at helping you understand concepts involving business intelligence, data visualization, and tableau.

Power BI Examples, Demos & Tutorials
You asked for it. Here is a complete and in-depth course on how to use Power BI for data analysis.
How to Make AI & BI Work Together Like a Dream Team
Learn to combine AI and BI for maximum business value. Discover how to identify and assess AI use cases, explore common applications in BI, and see a live demo of PDF text extraction using computer vision.
Introduction to Analytics and Artificial Intelligence - AI Training for Beginners
Explore analytics and AI fundamentals, covering data mining, business intelligence, and various analytics types. Gain practical insights to enhance your skills in today's data-driven landscape.

Qlik Sense Tutorial for Beginners - Training
Comprehensive introduction to Qlik Sense, covering interface, data loading, chart creation, visualization editing, and app sharing. Ideal for beginners seeking hands-on experience with this powerful BI tool.

Hive Tutorial - Hive Architecture - Hadoop for Beginners - Big Data for Beginners
Comprehensive tutorial on Apache Hive, covering its architecture, SQL-like querying, and integration with Hadoop for efficient big data processing and analysis.
Business Intelligence Tutorial for Beginners - What is Business Intelligence - Applications of BI
Explore how businesses leverage data for informed decision-making, real-time analysis, and industry-specific applications in airlines, retail, and telecom sectors to drive growth and efficiency.