Power BI Training
Become an expert in Power BI, data and analytics reporting tool, through this tutorial series from Learnit training
Power BI Crash Course for Beginners - Analyze & Visualize Data with Power BI Desktop
Learn to prepare, analyze, and visualize data using Microsoft Power BI Desktop. This beginner-friendly tutorial covers installation, data connection, query editing, and creating impactful visuals.
Data Visualization Tutorial
Learn to create impactful visualizations using Python libraries and tools like Tableau and PowerBI. Hands-on demonstrations cover Matplotlib, Seaborn, and Plotly for effective data presentation and insights.
Power BI Desktop - Data Modeling & Interactive Visualizations
Learn data modeling and interactive visualization in Power BI Desktop. Import Excel files, build DAX formulas, create data models, and design interactive visualizations for effective data analysis and business intelligence.

Power BI Master Tutorial
Master data processing and visualization with Power BI. Learn to build queries, prep data, create relationships, and develop interactive dashboards. Gain skills in advanced analytics, AI visuals, and custom visualizations.

M Code Class from Basic to Advanced - Power Query Excel & Power BI, Custom Functions
Comprehensive tutorial on M Code in Power Query for Excel and Power BI, covering basics to advanced topics like custom functions, data types, and lookups. Ideal for mastering data manipulation.

Power BI Examples, Demos & Tutorials
You asked for it. Here is a complete and in-depth course on how to use Power BI for data analysis.
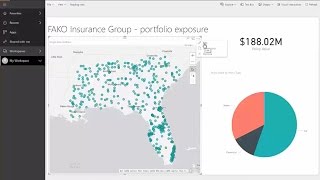
ArcGIS Maps for Power BI
ArcGIS Maps for Power BI offers enhanced mapping and analysis capabilities, demographic data, and compelling visualizations.
PowerBI
Learn to harness PowerBI for business intelligence, from installation to advanced data transformation techniques using Power Query, enhancing your data analysis skills.

Introduction to Power BI - What Is Power BI - Business Intelligence
In this tutorial, we have covered all the important topics such as, What is Business Intelligence, What is Power BI, Components of Power BI, and much that will help you to understand this concept with ease.
Power BI Tutorial for Beginners - Visualization with Power BI
Great Learning brings you this video on “PowerBI Tutorial for Beginners” to help you set the right foot on starting out with Power BI. This video gives you a thorough insight into business intelligence, data visualization and data visualization tools.
Excel & Power BI Data Analysis Complete Class in One Video
Comprehensive guide to data analysis using Excel and Power BI, covering essential tools and techniques for importing, transforming, visualizing, and sharing data effectively.
Big Data Analysis with Power Pivot & Power BI - Visuals & DAX Formulas
Master advanced data analysis techniques using Power Pivot and Power BI, including data modeling, DAX formulas, and creating interactive visualizations for effective business insights.

Excel Data Analysis - Power BI Desktop, DAX Formulas, Relationships, Data Modeling & Visuals
Comprehensive guide to Power BI Desktop: data import, DAX formulas, relationships, modeling, and visualizations. Learn to create powerful reports and dashboards for advanced Excel data analysis.
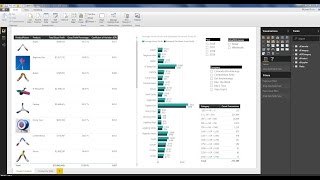
Power BI Desktop - Build Data Model, Get Data, DAX Formulas, Visualizations, Publish to Web
Comprehensive tutorial on building data models, creating DAX formulas, and designing visualizations in Power BI Desktop. Learn to import data, establish relationships, and publish interactive reports online.
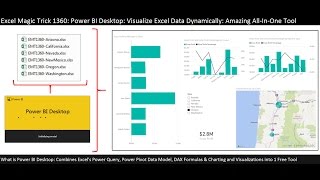
Comprehensive Power BI Desktop Example - Visualize Excel Data & Build Dynamic Dashboard
Learn to import, transform, and visualize Excel data in Power BI Desktop. Create dynamic dashboards with maps, charts, and slicers while mastering DAX calculations for insightful business analytics.
Two Fact Tables - DAX, Power Query or Worksheet Formulas to Convert to 1 Fact Table
Learn techniques to convert two fact tables into one using Excel formulas, DAX in Power Pivot, and Power Query in Power BI. Master data modeling and analysis skills for improved business reporting and decision-making.
Power Pivot - Big Data, Data Modeling, DAX & Dashboards
Aprenda a modelar dados, criar fórmulas DAX e construir dashboards usando Power Pivot. Importe dados SQL, crie tabelas de datas e explore recursos avançados para análise de negócios eficiente no Excel.
DAX Iterators, Table Functions, Grain, Cardinality, Materializing Tables Excel & Power BI
Comprehensive guide to DAX iterators and table functions in Excel Power Pivot and Power BI, covering advanced concepts like context transition, cardinality, and performance optimization.
Power BI Desktop Comprehensive Introduction - Power Query, DAX, Dashboards, Publishing
Comprehensive Power BI Desktop tutorial covering data import, DAX formulas, dashboard creation, and report publishing. Master essential skills for effective data analysis and visualization.
Comprehensive Introduction to Excel Power Pivot, DAX Formulas and DAX Functions
Comprehensive guide to Excel Power Pivot, DAX formulas, and functions. Learn data modeling, building relationships, and creating advanced calculations for powerful business intelligence dashboards.