Leveraging Business Intelligence in ERP Implementations
Unlock strategies for integrating business intelligence into ERP implementations, maximizing technology investments and enhancing analytics capabilities.
Smart Retailing: Optimization Techniques for Strategic Success
Dive into data-driven retail optimization techniques, leveraging analytics and machine learning to enhance decision-making, streamline processes, and boost profitability in the retail sector.
AIOps in AWS - Best Approach for Predictive Maintenance
Explore AIOps implementation in AWS for predictive maintenance, covering CloudWatch capabilities, data lake approaches, and DevOps Guru for enhanced cloud operations and incident management.
Develop Dashboard for Business Intelligence & Data Science - Plotly Dash Tutorial Series
Learn to create interactive, secure, and deployable dashboards using Plotly Dash for data science and business intelligence applications.
Crystal Reports for Visual Studio Tutorials
Learn to integrate Crystal Reports with Visual Studio, covering installation, data printing, filtering, multi-table reports, grouping, exporting, and advanced features like barcodes and charts.
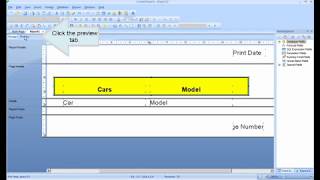
Crystal Reports Tutorial - Crystal Reports for Beginners
Learn to create, format, and enhance reports using Crystal Reports, covering formulas, parameters, subreports, charts, and advanced features for comprehensive data presentation.
Crystal Report 11 Video Tutorials
Comprehensive video tutorials covering Crystal Reports XI, from basic report creation to advanced techniques like cross-tab reports and Excel exports. Ideal for mastering this powerful reporting tool.
Crystal Report Tutorial for Beginners
Learn to create and manipulate Crystal Reports with C# and SQL Server, covering basics to advanced features like subreports, watermarks, and data grouping.
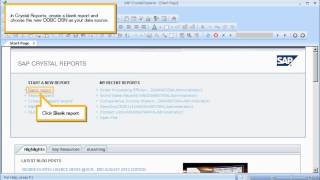
SAP Crystal Reports Tutorials
Comprehensive tutorials for SAP Crystal Reports 2011/2013, covering data connections, report creation, formatting, formulas, and advanced features for efficient business reporting.
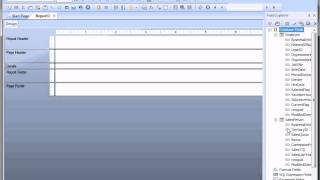
Crystal Reports Tutorials
Comprehensive video tutorials covering basic to advanced Crystal Reports techniques, including database connections, report design, formatting, and integration with various systems.
Crystal Reports Tutorial
Learn to create professional reports with summary fields, formatting, headings, and formulas. Step-by-step guide for Visual Studio integration and enhanced readability.

Data Science for Beginners - Python for Data Science
This full course on Data Science from Great Learning is ideal for both beginners and professionals who want to upskill in one of the highly trending domains of the industry. It covers topics as fundamental as statistics and data to Logistic and Linear Re…
Power BI Tutorial for Beginners - Visualization with Power BI
Great Learning brings you this video on “PowerBI Tutorial for Beginners” to help you set the right foot on starting out with Power BI. This video gives you a thorough insight into business intelligence, data visualization and data visualization tools.
Market Basket Analysis - Apriori Algorithm Explained - Time Series
Learn market basket analysis, Apriori algorithm, sales prediction, text analysis, and sentiment analysis for business intelligence. Gain practical skills in data-driven decision-making and customer behavior prediction.
Data Visualization with Tableau
Learn to create interactive visualizations and dashboards using Tableau. Master data interpretation, business intelligence concepts, and various visualization techniques for effective data-driven decision-making.
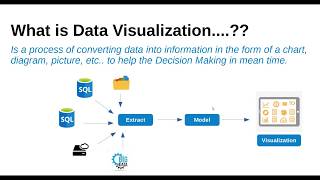
Data Visualization Tutorial
Learn essential data visualization concepts, explore BI tools, and master QlikSense for effective data transformation and dashboard creation.
Tableau Tutorial
Learn Tableau's key features, architecture, and data visualization techniques including charts, plots, and KPIs for effective business intelligence analysis.

Machine Learning
Comprehensive introduction to machine learning, covering algorithms, data analytics, and predictive modeling. Includes hands-on tutorials on data preparation, visualization, and decision tree implementation.
Decision Support Systems
Explore decision support systems, from basic concepts to advanced techniques like expert systems and neural networks, enhancing your ability to make informed business choices.
Azure Functions - Discover OpenAPI and Power Apps
Explore integrating Web API projects and Azure Functions with OpenAPI, and learn to consume APIs in Power Apps, Mobile Apps, and Progressive WebApps for enhanced development capabilities.
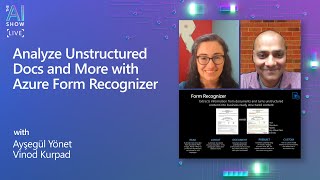
Analyzing Unstructured Documents with Azure Form Recognizer - Episode 52
Explore Azure Form Recognizer's latest updates for analyzing unstructured documents, including capabilities, pricing, and a live demo. Learn how this tool can streamline document processing and data extraction tasks.