
Tableau Business Intelligence - Beginner Tutorial for Dashboard Creation
Learn to create insightful Tableau dashboards with interactive visualizations, custom reports, and data analysis techniques for real-world business scenarios and effective decision-making.

Tableau Business Intelligence - Intermediate Techniques and Dashboard Design
Elevate your Tableau skills with advanced techniques for creating insightful dashboards. Learn to analyze data, visualize trends, and apply cluster analysis to real-world business scenarios.
Activating Microsoft Fabric with Real-time Data for Analytics and AI
Explore real-time data streaming and integration for Microsoft Fabric, enabling advanced analytics and AI capabilities with Striim's new adapters for data warehouses and lakehouses.

Navigating a Full Stack Knowledge Architecture from Database to LLM
Explore the convergence of data, language, and wisdom in Full Stack Knowledge Architecture, combining LLM power with query language precision to navigate data through innovative access patterns.

Excel Pivot Tables Tutorial - From Basics to Advanced Techniques
Master Excel Pivot Tables: Analyze complex data, create insightful charts, and leverage advanced features like Power Pivot and DAX expressions for powerful data manipulation and visualization.

Excel Copilot Tutorial - Boosting Productivity with Microsoft's AI Assistant
Learn to leverage Microsoft Copilot in Excel for data analysis, visualization, and task automation. Boost productivity with AI-powered insights, formulas, and problem-solving capabilities.

Attempting to Tame the Data Beast: A BI Transition Tale
Explore the journey of modernizing a BI platform, from legacy systems to cutting-edge tools. Learn about data ingestion, dbt transformations, and Airflow orchestration, along with insights on overcoming challenges.
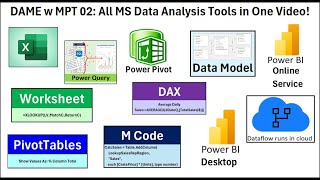
Microsoft Data Analysis Tools: Excel, Power Query, Power BI, Dataflow, DAX and M Code
Comprehensive tutorial on Microsoft data analysis tools, covering Excel, Power Query, Power BI, and more. Learn formulas, data modeling, and visualization techniques for effective data analysis.
PivotTables for Quick and Easy Reports - 34 Advanced Techniques
Master PivotTables with 34 advanced techniques for efficient data analysis and reporting. Learn to handle large datasets, create custom calculations, and generate insightful visualizations in Excel.

How HR Teams Can Create Happier Workplaces
Explore HR's evolution from administrative to strategic, focusing on employee experience, technology, and modern theories. Learn how HR can create happier workplaces and drive organizational success.

Instant Insights: Turning the World's Data into Clarity
Explore how transforming unstructured data into instant insights can revolutionize decision-making in businesses and governments, driving societal progress and human advancement.

Tableau Business Intelligence Master Tutorial - Advanced Dashboard Design and Analytics
Master Tableau for business intelligence: create interactive dashboards, custom reports, and insightful visualizations. Learn best practices, innovative techniques, and real-world applications to elevate your data analysis skills.
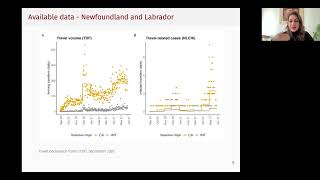
Pandemic Decision Support: Importation Models and Travel Restriction Measures
Explore importation models and travel restrictions for pandemic decision-making, focusing on their effectiveness and implications for public health strategies.

Tableau Business Intelligence - Full Course Tutorial
Comprehensive Tableau tutorial covering diverse business scenarios, from personal finance to global data analysis. Learn to create interactive dashboards and gain practical BI skills through hands-on projects.
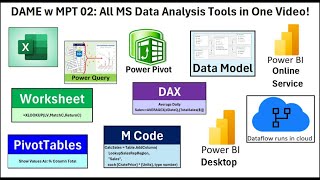
Microsoft Data Analysis Tools: Excel, Power Query, Power BI, Dataflow, DAX, and M Code
Comprehensive tutorial on Microsoft data analysis tools, covering Excel, Power Query, Power BI, and more. Learn to import, transform, and visualize data using various techniques and formulas.
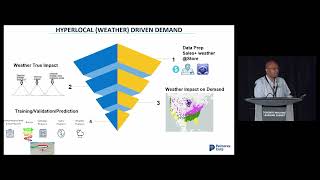
AI at Scale to Understand Impact of Weather on Businesses
Explore how AI scales to analyze weather's impact on business, leveraging historical data to predict demand and inform decision-making across industries.
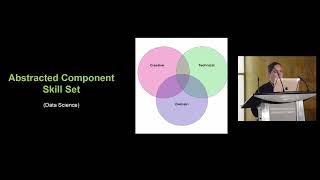
Data Storytelling for Beginners
Explore effective data storytelling techniques, blending math, science, art, and communication, with real-world examples from Shopify's practices.
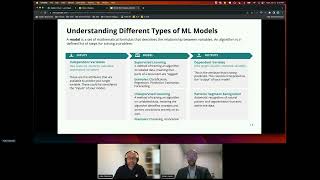
Creating an ML Model as a Business User
Validate use cases, build models, and develop business cases for ML deployment as a non-technical user.
Introduction to Dataverse for Low Database Maturity Businesses
Explore structured data organization with Dataverse, ideal for businesses with low database maturity seeking to enhance their data management practices.

Timespan Fact Tables: Handling Historical Data in Data Warehousing
Explore practical applications of Timespan Fact Tables for handling historical data, including row effective dates, expiration dates, and current row indicators.

Power Query in 20 Minutes - How it Works
Explore Power Query's internals and gain a deeper understanding of this increasingly prevalent tool in Power BI and Fabric technologies.