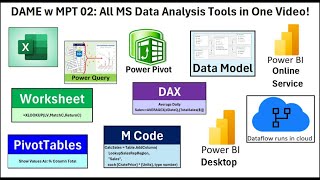
Microsoft Data Analysis Tools: Excel, Power Query, Power BI, Dataflow, DAX, and M Code
Comprehensive tutorial on Microsoft data analysis tools, covering Excel, Power Query, Power BI, and more. Learn to import, transform, and visualize data using various techniques and formulas.
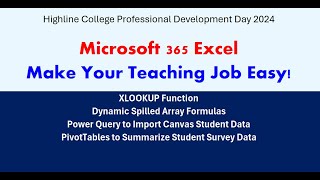
Excel 365 for Teaching: Dynamic Arrays, XLOOKUP, Power Query and PivotTables
Streamline teaching tasks with Excel 365: master dynamic arrays, XLOOKUP, Power Query, and PivotTables for efficient gradebooks, budgets, and data analysis.
End-to-End SQL Server PowerPivot
Explore SQL Server PowerPivot add-ins for Excel and SharePoint, enabling large-scale data analysis, multidimensional modeling, and collaborative business intelligence within familiar Microsoft tools.
PowerPivot - A Cool Reporting Tool
Explore PowerPivot for Excel to combine diverse data sources, create analytics, and overcome Excel limitations. Learn to import, pivot, and visualize data for self-service business intelligence.
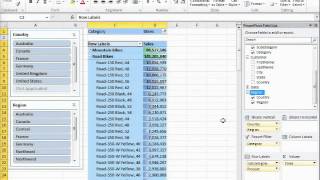
End-to-End SQL Server PowerPivot
Explore SQL Server PowerPivot add-ins for Excel and SharePoint, enabling large-scale data analysis, multidimensional modeling, and collaborative BI solutions with scheduled data refreshes and IT management.

Modern Excel - The Supercomputer Hiding on Everyone’s Desktop
Discover game-changing Excel tools for data-driven decisions. Learn multi-source import, rapid data shaping, portable formulas, and insightful reporting techniques to supercharge your spreadsheet skills.
Creating PivotTables and PivotCharts Dashboards with Slicers in Excel
Learn to create interactive Excel dashboards using PivotTables, PivotCharts, and Slicers. Master data visualization techniques, customize slicer appearance, and integrate timeline slicers for date-based filtering.

Excel Automation Essentials - Streamlining Workflows and Boosting Productivity
Master Excel automation: functions, conditional formatting, AI tools, PivotTables, and Power Query. Boost productivity with advanced techniques like Excel Bot and GPT Excel.

Data Models, PivotTables, and Power Query in Excel - Advanced Data Analysis Techniques
Master advanced Excel data analysis by combining PivotTables, data models, and Power Query to transform complex datasets into meaningful insights. Learn to create relationships, clean data, and generate powerful analytical reports.

Cleaning Data and Building Reporting Dashboards in Excel - From Power Query to Interactive Visualizations
Master data cleaning and visualization in Excel through Power Query, PivotTables, and interactive dashboard creation. Transform raw data into meaningful insights while automating your workflow.