PivotTables & Slicers - Create Dashboards & Summary Reports
Master PivotTables, Slicers, and dashboards in Excel. Create cross-tab reports, frequency distributions, and custom calculations for effective data analysis and visualization.
Excel Spreadsheet Formulas - Old School or Dynamic Arrays?
Learn to use Excel formulas for data analysis, comparing traditional methods with dynamic arrays. Master SUMIFS, COUNTIFS, and AVERAGEIFS for creating effective summary reports.
Comprehensive Introduction to Excel Power Pivot, DAX Formulas and DAX Functions
Comprehensive guide to Excel Power Pivot, DAX formulas, and functions. Learn data modeling, building relationships, and creating advanced calculations for powerful business intelligence dashboards.
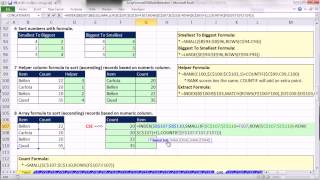
Ctrl - Shift - Enter- Excel Array Formulas - Extract Unique Lists & Sorting Formulas
Learn advanced Excel techniques for extracting unique lists, sorting data, and creating efficient array formulas to solve complex data analysis problems and enhance spreadsheet functionality.

Excel for Accounting - Formulas, VLOOKUP & INDEX, PivotTables, Recorded Macros, Charts, Keyboards
Master Excel for accounting with advanced formulas, PivotTables, macros, and charts. Learn efficient techniques for data analysis, reporting, and visualization to enhance your financial workflow.

Hack Data Model, Date Table & DAX Measures Without Buying Power Pivot
Master advanced Excel techniques: build data models, create DAX measures, and use functions like CALCULATE and TOTALYTD. Learn to optimize PivotTables and implement variables for efficient data analysis.

Excel for Accountants - Power Query & PivotTables to Import & Clean Data and Build Reports
Learn to import, clean, and analyze data using Power Query and PivotTables. Master techniques for efficient data management, creating insightful reports, and optimizing file size in Excel for accounting purposes.
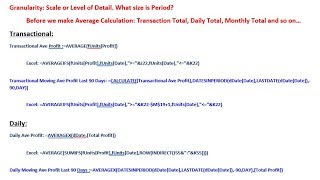
Average, Moving Average at Different Granularity - DAX or Excel Formulas
Learn advanced Excel and DAX techniques for calculating averages and moving averages at different granularities, enhancing your data analysis skills for more accurate financial reporting.
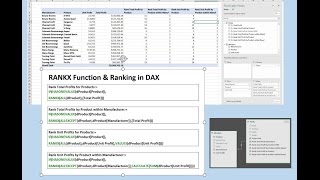
RANKX DAX Function and More - Ranking Profit for Products within Manufacturer
Aprenda a usar a função RANKX DAX para classificar lucros de produtos por fabricante em PivotTables do Excel. Domine técnicas avançadas de análise de dados e fórmulas DAX.

Excel Basics - Power Query (Get & Transform) to Clean & Transform Data into Proper Data Set
Learn to use Power Query in Excel for data cleaning, transformation, and analysis. Master importing, combining, and refreshing data from various sources to create proper datasets and pivot tables.

Excel Basics - PivotTable Power - Amazing PivotTable Reporting Tricks - Slicers to Show Values As
Master advanced PivotTable techniques in Excel, including slicers, custom calculations, and data analysis. Learn to create powerful reports and gain insights from complex datasets.
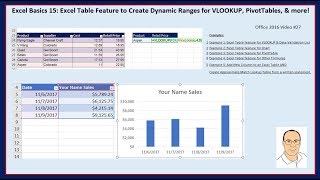
Excel Basics - Excel Table Feature & Dynamic Ranges for VLOOKUP, PivotTables, & More
Learn to leverage Excel's Table feature for dynamic ranges in VLOOKUP, PivotTables, charts, and more. Master efficient data management and analysis techniques for improved productivity.
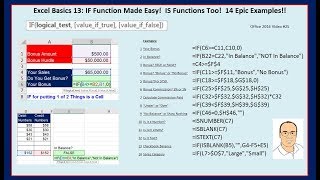
Excel Basics - IF Function Made Easy and IS Functions Too - Epic Examples
Master Excel's IF and IS functions with 14 practical examples, enhancing your data analysis and decision-making skills for various business scenarios.
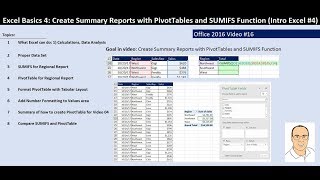
Excel Basics - PivotTables & SUMIFS Function to Create Summary Reports
Learn to create summary reports using PivotTables and SUMIFS function in Excel. Master data analysis techniques, proper data set creation, and efficient report formatting for regional, daily, and sales rep summaries.
Microsoft Excel PivotTables Explained
Learn to create, manipulate, and format PivotTables in Excel 2021/365. Master data analysis techniques, including field pivoting, grouping, and custom layouts for effective data visualization.

Excel 2019 Power User Tutorial
Advanced Excel techniques for data analysis, including VLOOKUP troubleshooting, INDEX MATCH, PivotTables, array formulas, conditional formatting, charts, and macros. Ideal for power users seeking efficient problem-solving methods.

Visualizing Data and Building Dashboards in Excel & Power BI
Comprehensive guide to data visualization and dashboard creation in Excel and Power BI, covering various chart types, PivotTables, Power Query, and advanced techniques for effective data presentation.

Logical Tests - Excel Formulas, Conditional Formatting, PivotTables, Power Query, and More
Master Excel's logical functions, formulas, and advanced features. Learn to create powerful data analysis tools using PivotTables, conditional formatting, and Power Query for efficient data management.

Excel 2019 Power User Tutorial
Advanced Excel techniques for data analysis, including VLOOKUP troubleshooting, INDEX MATCH, PivotTables, array formulas, conditional formatting, and macros. Ideal for users seeking to enhance efficiency and problem-solving skills.
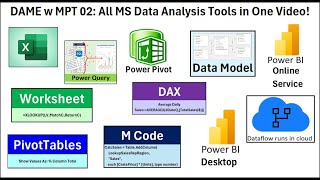
Microsoft Data Analysis Tools: Excel, Power Query, Power BI, Dataflow, DAX and M Code
Comprehensive tutorial on Microsoft data analysis tools, covering Excel, Power Query, Power BI, and more. Learn formulas, data modeling, and visualization techniques for effective data analysis.
PivotTables for Quick and Easy Reports - 34 Advanced Techniques
Master PivotTables with 34 advanced techniques for efficient data analysis and reporting. Learn to handle large datasets, create custom calculations, and generate insightful visualizations in Excel.