Tracing Adventures from Pull Request to Production - Using OpenTelemetry for Deploy Troubleshooting
Discover how distributed tracing and OpenTelemetry signals can improve collaboration between developers and operators while troubleshooting deployment issues from PR to production.
What is OpenTelemetry - Understanding Core Concepts and Implementation
Discover OpenTelemetry's core components, implementation strategies, and practical applications for logs, metrics, and tracing in modern cloud-native environments through hands-on examples and real-world scenarios.
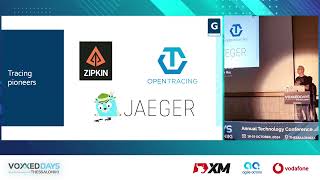
Practical Introduction to OpenTelemetry Tracing
Master distributed system monitoring with OpenTelemetry tracing, exploring implementation techniques and best practices for tracking requests across microservices architectures using open standards.
Making Java Applications Observable with OpenTelemetry - No Code Changes Required
Discover how to implement OpenTelemetry in Java applications for enhanced monitoring and observability across microservices, without modifying existing code. Learn configuration techniques and trace propagation.

OpenTelemetry: The Road Ahead and Meet the Community
Explore OpenTelemetry's future, recent releases, and roadmap with project leaders. Join a panel discussion and Q&A session to learn about observability advancements and community involvement.
Understanding Your System with OpenTelemetry, Grafana, and Promscale
Explore advanced system monitoring using OpenTelemetry, Grafana, and Promscale. Learn to visualize latency, trace services, and analyze dependencies for enhanced performance insights.
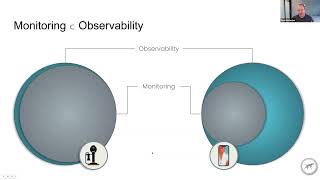
The Future of Observability in Cloud Native Systems
Explore the evolving landscape of observability in complex systems, focusing on Open Telemetry as a key trend and its impact on data collection and monitoring practices.
Tail-Based Sampling in OpenTelemetry Collector - Why, How, and Issues
Explore tail-based sampling in OpenTelemetry Collector: benefits, configuration, implementation in microservices, and current challenges for production deployments.
Better Reliability Through Observability and Experimentation
Explore techniques for improving system reliability through observability and experimentation, including simulated outages, OpenTelemetry, and OpenTracing to enhance service performance and resilience.

OpenTelemetry: The Vision, Reality, and How to Get Started
Explore OpenTelemetry's unified framework for observability data collection, its current state across projects, and practical guidance for implementation in your system.
The Amazing Trace: Enhancing Distributed WebAssembly with OTEL
Explore how OTEL tracing enhances distributed WebAssembly in wasmCloud, improving observability and debugging for developers in complex distributed systems.
Confidence with Chaos for Kubernetes Observability
Explore Kubernetes observability with Prometheus, SLOs, and chaos engineering. Learn practical insights for SREs and developers to enhance metrics, alerting, and incident response in production environments.
Adopting Open Telemetry Collector at eBay - Swapping Engines Mid-Flight
Explore eBay's transition from Elastic Beats to Open Telemetry Collector, addressing scale challenges in Kubernetes, annotation-based discovery, and ensuring seamless metric collection during migration.
Leveraging OpenTelemetry for Your Prometheus Pipeline
Explore OpenTelemetry's integration with Prometheus, covering receivers, exporters, migration paths, and common scenarios for leveraging OTel in your metrics pipeline.
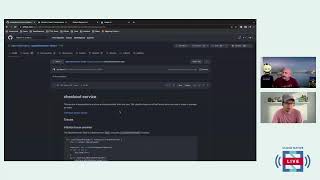
OpenTelemetry Community Demo - Cloud Native Live
Explore OpenTelemetry's capabilities in this live demo, showcasing its observability features and integration with cloud-native applications.
Analyzing and Visualizing OpenTelemetry Traces with SQL
Hands-on workshop exploring OpenTelemetry trace analysis using SQL and Grafana. Learn to ingest, query, and visualize distributed system data for powerful insights and proactive issue detection.

State of the OpenTelemetry Community - Keynote
Comprehensive overview of OpenTelemetry's community progress, achievements, and future roadmap, presented by governance committee members Morgan McLean and Alolita Sharma.
The Unexplored World of OpenTelemetry and Service Mesh
Explore the pros and cons of using service mesh tools like Istio for generating traces compared to OpenTelemetry. Learn about sampling, third-party services, implementation, and visualization to make informed decisions.
Continuous Profiling in Cloud Native Applications
Explore continuous profiling in cloud-native environments, discussing implementation strategies, challenges, and its integration with service mesh and observability tools.
Meet the OpenTelemetry Maintainers Panel - Deep Dive into Metrics Specification
Panel discussion on OpenTelemetry Metrics specification, exploring its unique features, Prometheus compatibility, and future directions. Opportunity for Q&A with maintainers to gain insights into this evolving technology.

OTel Me All About OpenTelemetry - Introduction to OpenTelemetry
Explore OpenTelemetry's observability framework, its components, and implementation strategies for effective application monitoring and performance optimization.