Fluent Bit - Unifying Logs, OpenMetrics, and OpenTelemetry
Explore Fluent Bit's expanded capabilities for unified observability, integrating logs, metrics, and traces using OpenMetrics and OpenTelemetry protocols. Learn optimization techniques for efficient data collection and aggregation at scale.
Building Observability Pipeline with Fluent-Bit
Learn how LinkedIn built observability pipelines using OpenTelemetry and Fluent-bit, exploring their decision-making process, enhancements, and benefits for efficient data collection and monitoring.
Fluent Bit V2.0 - Unifying Open Standards for Logs, Metrics and Traces
Explore Fluent Bit v2.0's unified approach to observability, integrating logs, metrics, and traces. Learn techniques, best practices, and production deployment tips for modern observability tools.
Observability Considerations for Infrastructure Cost Optimization
Explore observability strategies for cloud-native infrastructure cost monitoring, examining open-source projects like OpenTelemetry and OpenCost to enhance cost optimization solutions.
Fluent Bit v3 - Unified Layer for Logs, Metrics and Traces
Explore Fluent Bit v3's unified approach to logs, metrics, and traces. Learn integration with OpenTelemetry and Prometheus for enhanced observability in cloud-native environments.
OpenStack Observability Revamped - Monitoring and Debugging at Scale
Discover modern approaches to OpenStack monitoring and debugging through advanced observability tools like Prometheus, OpenMetrics, and OpenTelemetry, enhancing infrastructure management at scale.
Thinking Cloud Native - CloudEvents Future
Explore the future of cloud-native communication and integration through CloudEvents, focusing on interoperability, discovery, and metadata description for seamless project connectivity.
Sustainability Through Accountability in a CNCF Ecosystem
Explore sustainable cloud computing through carbon footprint tracking in multi-tenant services. Learn to combine CNCF projects for energy consumption estimation in storage systems, benefiting users and developers.
What Could Go Wrong with a GraphQL Query and Can OpenTelemetry Help?
Explore GraphQL challenges in production and how OpenTelemetry can assist. Learn about potential improvements for better troubleshooting and performance monitoring in GraphQL-based APIs.
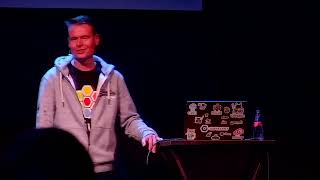
Service Mesh Without the Mess - Implementing Cilium Service Mesh with eBPF
Explore service mesh implementation using Cilium and eBPF, covering monitoring, tracing, and performance optimization for distributed systems like Kubernetes.
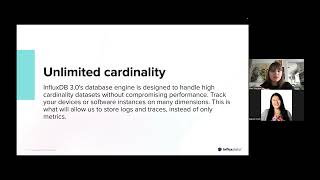
Gain Better Observability with OpenTelemetry and InfluxDB
Explore OpenTelemetry and InfluxDB for enhanced observability in cloud-native environments, improving system monitoring and performance analysis.
FinOps Observability: Monitoring Kubernetes Cost with OpenCost
Explore FinOps principles and learn to monitor Kubernetes costs using OpenCost. Gain insights into cloud financial management and optimize resource allocation in cloud-native environments.
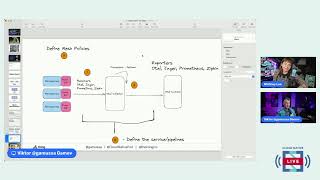
Streamline Service Mesh Observability with Kuma and OpenTelemetry
Streamline service mesh observability using Kuma and OpenTelemetry. Learn to enhance monitoring, tracing, and metrics collection for improved cloud-native application performance and reliability.
Build Progressive Delivery and Safety Into Apps with Feature Flags
Learn how OpenFeature enables progressive delivery and safer apps through vendor-neutral feature flagging, combined with OpenTelemetry observability for zero-downtime runtime adjustments.
Service Mesh Tracing Observability with Kuma and OpenTelemetry
Explore Kuma and OpenTelemetry integration for enhanced service mesh observability, enabling efficient tracing and monitoring of distributed microservices architectures.
WeAreDevelopers LIVE - Python Day
Explore Python's versatility with expert talks on Kafka debugging, repository testing, machine learning, and OpenTelemetry in this comprehensive live event for developers of all levels.
Piercing the Veil of WebAssembly in Production
Explore challenges and solutions for monitoring WebAssembly in production, introducing the Observe toolkit for seamless integration of WebAssembly observability data with traditional systems.
What's New in gRPC - Recent Features and Microservices Tips
Explore recent gRPC features including OpenTelemetry, Service Mesh, K8s Gateway APIs, and GAMMA. Learn tips for building microservices applications with gRPC.
Elia's Strategy for Streamlining Superior .NET 8 Microservices Application Development with Dapr and KubeMQ
Explore Elia Group's approach to enhancing .NET 8 microservices development using Dapr and KubeMQ. Learn about improved communication, streamlined processes, and practical examples for efficient, resilient, and secure distributed systems.
Automatically Instrument Your Go Source Code with Orchestrion
Explore Orchestrion, an extensible tool for automatic Go code instrumentation. Learn about parsing, code analysis, distributed tracing, and using annotations for cross-cutting concerns.
The Anatomy of a Distributed Trace - Understanding OpenTelemetry and Observability
Delve into distributed tracing fundamentals, exploring OpenTelemetry implementation, trace components, metadata analysis, and how logs and metrics support system-wide monitoring and troubleshooting.