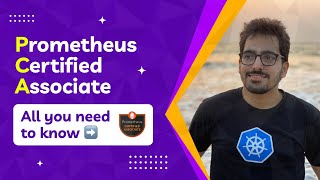
Prometheus Certified Associate (PCA) Certification Overview and Demo
Explore Prometheus certification, prepare with resources, and learn to instrument applications for data pushing to Prometheus via pushgateway. Includes demo and comprehensive course overview.
KubeRay: A Ray Cluster Management Solution on Kubernetes
Explore KubeRay's integration with Kubernetes, its capabilities for Ray cluster management, and performance benchmarks for simplified deployment of Ray applications.
Observability Supercharger: Building Traffic Topology Maps for Millions of Containers with Zero Code
Leveraging eBPF to build universal traffic topology maps for millions of containers, enabling distributed tracing and optimizing performance with minimal impact on production environments.
Implement Auto Instrumentation Under GraalVM Static Compilation on OTel Java Agent
Explore GraalVM static compilation's impact on Java applications and learn about a static instrumentation solution for OTel Java Agent, enhancing performance in cloud-native environments.
Organization-wide Observability with HCP Terraform and AWS CloudWatch
Centralized monitoring across AWS accounts using CloudWatch OAM and HCP Terraform. Learn deployment strategies, project structuring, and simplified management for multi-account infrastructures.
Production Data Applications for AI-Driven Observability
Explore AI-driven observability in Databricks' Data Intelligence Platform. Learn to create scalable apps with Plotly Dash, enabling non-technical users to manage workflows and leverage LLMs for data analysis.
KubeVirt Observability with Prometheus and Grafana
Explore KubeVirt observability using Prometheus and Grafana for enhanced monitoring and visualization of virtualized workloads in Kubernetes environments.
What Could Go Wrong with a GraphQL Query and Can OpenTelemetry Help?
Explore challenges in GraphQL production, learn how OpenTelemetry can help troubleshoot performance issues, and discuss improvements for better GraphQL monitoring and reliability.
GraphQL Observability with Elastic and OpenTelemetry
Explore implementing comprehensive observability for federated GraphQL APIs using OpenTelemetry and Elastic, enabling proactive performance management and error detection.
GraphQL Observability with Elastic and OpenTelemetry
Explore GraphQL API maintenance in production using OpenTelemetry and Elastic Observability for comprehensive insights, enabling proactive performance management in federated GraphQL solutions.
GraphQL Observability with Elastic and OpenTelemetry
Explore GraphQL API maintenance in production using OpenTelemetry and Elastic Observability for comprehensive insights, enabling proactive performance management in federated solutions.
Observable Web Applications
Explore techniques for enhancing client-side observability through error tracking, performance monitoring, and usage analytics to gain insights into real user experiences and system behavior.
Databricks Workflows: Practical How-Tos and Demos
Explore Databricks Workflows for efficient data pipeline orchestration. Learn best practices, serverless jobs, job repair, notifications, event-driven integrations, and effective triggers for optimized data intelligence.
How to Use OpenTelemetry to Trace and Monitor Apache Kafka Systems
Gain insights into Apache Kafka event systems using OpenTelemetry for tracing and monitoring. Learn about application-level tracing, native Kafka support, and implementing event-level tracing in distributed systems.
Getting the Most Out of Your Logs at 3 AM - Effective Logging Practices
Learn effective logging practices for troubleshooting, monitoring, and security. Explore structured logging, proper log levels, and storage solutions to optimize your application's observability and performance.
AWS: Your Ally Against Observability Anti-Patterns
Explore AWS's role in combating observability anti-patterns, covering digital transformation, distributed systems, and microservices. Learn about logs, metrics, tracers, and AWS's observability maturity model.
OpenTelemetry Collector Configuration - Mastering Setup and Deployment
Master OpenTelemetry Collector configuration through expert insights and hands-on demonstrations. Gain practical knowledge on components, setup options, and best practices for effective implementation.
From Metrics Tsunami to Actionable Insights - Simplifying Database Troubleshooting with ClusterControl
Simplify database troubleshooting with ClusterControl. Learn about holistic dashboards, performance monitoring, query analysis, and fault detection for actionable insights in database management.
OpenTelemetry 101 - A Guide to Tracing, Metrics, and Logs
Explore OpenTelemetry fundamentals, including tracing, metrics, and logs. Learn core concepts, application instrumentation, and infrastructure through hands-on demos and practical insights.
Why Decentralized Monitoring Matters
Explore decentralized monitoring's advantages over centralized systems, focusing on fidelity, scalability, cost, accuracy, resilience, efficiency, and data privacy. Learn about Netdata's approach and future trends.
Observability for Modern Event-Driven Applications
Explore observability techniques for modern event-driven applications, focusing on AWS tools like CloudWatch, X-Ray, and Lambda Insights to enhance monitoring and troubleshooting capabilities.