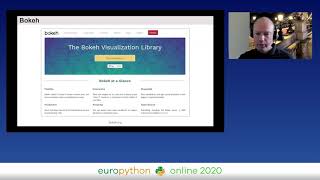
The Python Data Visualization Landscape in 2020
Explore Python's data visualization libraries including Matplotlib, Plotly, Bokeh, and Altair. Learn about dashboarding solutions like Dash, Panel, and Voila, and understand their key features and recent developments.
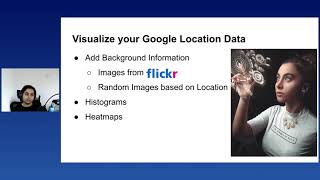
Virtual Tourism in COVID Times
Explore building an interactive dashboard using Python to relive past travels during lockdown. Learn data processing, visualization, and integration of external sources for a personalized virtual tourism experience.
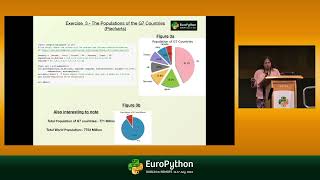
Creating the Next Generation of Billionaires - Part 4
Explore how young people use Python to analyze real-world issues like climate change and population growth, showcasing the impact of early programming education on problem-solving skills.
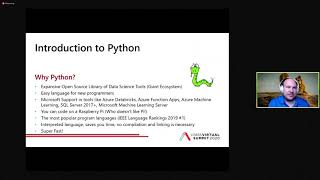
Code Like a Snake Charmer Version 2.0 - Introduction to Python
Comprehensive introduction to Python for data science, covering basics and machine learning using real-world datasets. Ideal for beginners looking to integrate Python into Microsoft tools.

ME3255 - Python Code Examples from Discussion
Learn Python coding techniques for mechanical engineering applications through practical examples and discussions.
Getting Started with Python in Microsoft Excel - A Beginner's Tutorial
Discover how to leverage Python's powerful data analysis and visualization capabilities directly within Microsoft Excel, from basic syntax to advanced libraries like Pandas and Matplotlib.
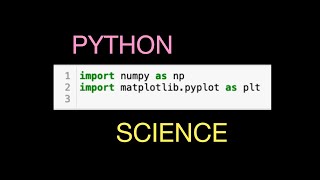
Physics Python Warm Up Questions Using Numpy
Master Python for physics: import libraries, create arrays, plot data, manipulate matrices, calculate eigenvalues, and handle complex data structures.
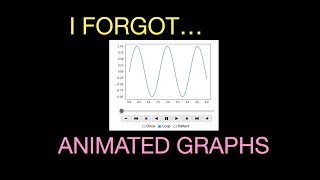
Three Ways to Make Animated Graphs in Python
Learn three simple techniques for creating animated graphs in Python using matplotlib and vpython, from basic to advanced methods.

Sholl Analysis Using Python - Quantifying Neuronal Branching Patterns
Learn to perform Sholl analysis on neuronal images using Python, quantifying branching complexity and comparing neuronal structures across different conditions or cell types.

Visual Data Storytelling with Blender and Python
Discover how to create immersive 3D animations for data storytelling by combining Blender's 3D capabilities with Python's 2D plotting libraries, enhancing your data visualization skills.
Making Beautiful, Publication Quality Tables in Python - 2024 Update
Explore techniques for creating visually appealing, publication-ready tables in Python, bridging the gap between raw DataFrame output and structured, informative displays.
Top 4 Python Libraries for Data Science
Explore four essential Python libraries for data science: NumPy, Pandas, Matplotlib, and Seaborn. Learn their key benefits and practical applications in fundamental data science concepts.
Python and Data Storytelling to the Rescue: Avoiding Deaths by PowerPoint
Explore innovative Python tools and data storytelling techniques to create engaging, impactful presentations. Learn to combine interactivity and memorability for more effective communication.
Visual Data Storytelling with Blender and Python
Create immersive 3D data visualizations by combining Blender's animation capabilities with Python's 2D plotting libraries for impactful storytelling and enhanced data interpretation.
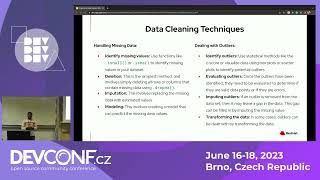
EDA Techniques for Data Analysis
Explore powerful Exploratory Data Analysis techniques for cleaning, visualizing, and understanding datasets to drive insights and inform decision-making in business contexts.
Building a Data Visualization App for Mobile Phones Using Python
Learn to create mobile data visualization apps using Python tools like NumPy and Matplotlib, without needing specialized mobile development skills.
Creative Coding with py5 - The Python Version of Processing
Explore py5, a Python framework for creative coding similar to Processing. Learn data visualization, art creation, and educational applications using familiar Python libraries.

Python and Data Storytelling - Avoiding Deaths by PowerPoint
Explore innovative Python tools and data storytelling techniques to create engaging, interactive presentations that captivate audiences and enhance information retention.

Building a Data Visualization App for Mobile Phones Using Python
Learn to create mobile data visualization apps using Python tools like NumPy and Matplotlib, without needing specialized mobile development skills.

Creative Coding with py5 - The Python Version of Processing
Explore py5, a Python framework for creative coding similar to Processing. Learn data visualization, art creation, and educational applications using familiar Python libraries.

Making Beautiful, Publication Quality Tables in Python - 2024 Update
Explore techniques for creating visually appealing, publication-ready tables in Python, bridging the gap between raw DataFrame output and structured, informative displays.