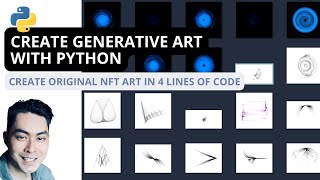
Creating Generative Art with Python - Tutorial for NFT Enthusiasts
Learn to create unique generative art using Python and the Samila library. Explore techniques for color, seeding, projection types, and iterative creation for NFT-style artwork.

Python Audio Processing Basics - How to Work With Audio Files in Python
Explore Python audio processing: work with mp3/wave files, analyze sampling rates, plot waveforms, record audio, and use PyAudio/PyDub libraries for comprehensive audio manipulation.

Python Plotting Tutorial with Matplotlib and Pandas - Line Graph, Histogram, Pie Chart, Box and Whiskers
Learn to create line graphs, histograms, pie charts, and box plots using Matplotlib and Pandas in Python. Visualize real-world data from CSV files, including global gas prices and FIFA player statistics.
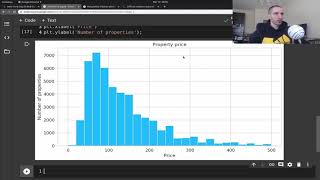
Data Visualization Tutorial for Beginners with Matplotlib in Python - Exploratory Data Analysis
Explore fundamental data visualization techniques using Matplotlib and Seaborn in Python. Learn to create histograms, box plots, violin plots, bar charts, line charts, scatter plots, and more for effective exploratory data analysis.

Matplotlib Tutorial for Beginners
Learn to visualize data with Matplotlib in Python. Master line charts, limit values, and figures to create compelling data representations for analysis and presentation.
The Matplotlib Crash Course
Learn to create, label, and customize graphs using Matplotlib, including axes manipulation, zooming, and creating subplots in this concise tutorial.
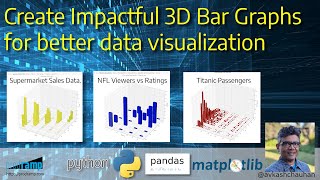
Create Impactful 3D Bar Graphs for Better Data Visualization
Learn to create impactful 3D bar graphs using Python libraries like Pandas and Matplotlib. Explore real-world datasets and master techniques for effective data visualization.
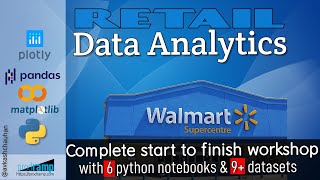
Getting Started with Retail Data Analytics
Develop retail data analytics skills using Python libraries to create consumer profiles, purchase histories, and interactive dashboards with geo-traceable data from 4500+ Walmart stores.
Python for Finance - Introduction to Stock Market Analysis
Learn to analyze stock market data using Python, covering Numpy, Pandas, Matplotlib, data manipulation, statistical calculations, and visualization techniques for financial analysis.

Intro to Data Analysis - Visualization with Python, Matplotlib and Pandas - Matplotlib Tutorial
Learn Python data analysis and visualization using Matplotlib and Pandas. Covers installation, data importing, plotting techniques, and real-world population growth analysis.
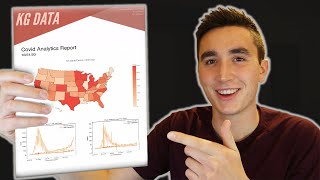
How to Generate an Analytics Report in Python
Learn to create professional analytics reports in Python using FPDF. Generate visually appealing PDFs with custom layouts, images, and data visualizations from libraries like Matplotlib and Plotly.

Analyzing IPL Data Using Python
Learn to analyze IPL data using Python, pandas, matplotlib, and seaborn. Gain hands-on experience in data visualization and exploratory analysis while developing practical Python skills.
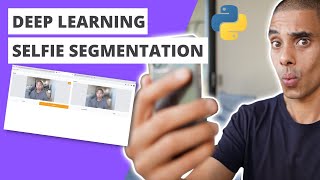
Build a Deep Learning Selfie Segmentation Web App Using Gradio
Learn to create a web app for selfie segmentation using Mediapipe, Gradio, and Python. Develop skills in background removal, machine learning integration, and app development with hands-on coding.

Legend Function in Matplotlib - Python Programming
Learn to effectively use the legend function in Matplotlib to enhance data visualization, including customization options and best practices for clear and informative plots.
Python Tutorial with Generative AI for Beginners - Full Course 2024
Comprehensive Python tutorial covering basics to advanced topics, including OOP, data structures, algorithms, machine learning libraries, generative AI, automation, and GUI development.
Coding a Neural Network - Full Stack Deep Learning - Spring 2021
Code a neural network from scratch using Google Colab, NumPy, PyTorch, and Keras. Learn linear regression and multi-layer perception models through hands-on implementation and visualization.
Implementing DeepMind's DQN from Scratch - Project Update
Explore DeepMind's DQN implementation process, including project organization, code walkthrough, and visualization techniques for reinforcement learning algorithms.

Fast Zero Shot Object Detection with OpenAI CLIP
Learn zero-shot object detection and localization using OpenAI CLIP, a multi-modal deep learning model. Implement practical techniques for efficient, domain-flexible computer vision tasks without fine-tuning.
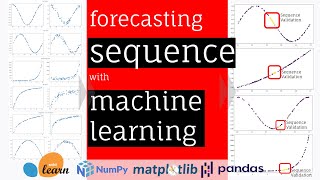
Forecast Any Mathematical Number Sequence with Regression - Machine Learning
Learn to generate and forecast mathematical number sequences using Python, pandas, numpy, and scikit-learn. Visualize data with matplotlib and apply regression models to predict future numbers in various function-based series.
Graph Neural Networks Implementation in Python
Learn Graph Neural Networks implementation in Python, covering graph representations, node embeddings, message passing, and practical applications using NetworkX and PyG libraries.
Predicting Wildfire Hotspots Using California Wildfire Data
Learn to predict wildfire hotspots using California data. Covers data collection, feature engineering, ML modeling with LightGBM/XGBoost/H2O.ai, and visualization techniques for effective wildfire risk assessment.