
Python Libraries in Hindi
हिंदी में Python लाइब्रेरीज़ का व्यापक अवलोकन - Numpy, Pandas, Matplotlib और Seaborn के मुख्य कार्यों और अवधारणाओं को उदाहरणों के साथ समझाया गया है। IPL केस स्टडी भी शामिल है।
Generate Data Science/Data Analysis Report of your Dataset in 5 Minutes
Learn to quickly generate comprehensive data science reports using Python, streamlining analysis and visualization for efficient insights from datasets.
Learn Python Programming in Hindi for Beginners - 2024 Edition
शुरुआती लोगों के लिए हिंदी में पायथन प्रोग्रामिंग सीखें। बुनियादी अवधारणाओं से लेकर डेटा विज़ुअलाइज़ेशन और प्रोजेक्ट्स तक, व्यावहारिक कौशल विकसित करें।

Live Breaking into Encrypted 3D Printer Firmware
Hands-on workshop on breaking encrypted 3D printer firmware, covering techniques like frequency analysis, known-plaintext attacks, and ARM architecture exploitation using tools such as Matplotlib and SciPy.

Introduction to Numerical Computing with NumPy - SciPy 2019 Tutorial
Learn NumPy's powerful array processing capabilities, including array syntax, indexing, mathematical functions, and custom routines. Gain practical skills through hands-on examples and visualize results using matplotlib.

Intro to Data Visualization in Python with Matplotlib - Line Graph, Bar Chart, Title, Labels, Size
Learn to create and customize line graphs and bar charts using Matplotlib in Python, covering essential visualization techniques like styling, scaling, and annotating plots.
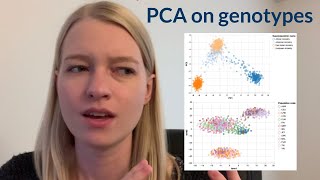
Genes and Geography - A Bioinformatics Project
Comprehensive bioinformatics walkthrough: analyze population genotype data using PCA/TSNE, from data acquisition to visualization, with practical coding in Python and Colab.
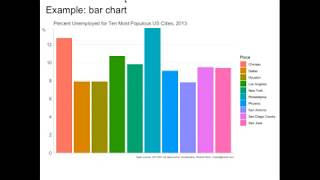
Data Visualization - From Square One to Interactivity
Learn to create effective data visualizations using Python libraries Matplotlib and Bokeh. Explore design principles, reduce clutter, and add interactivity to communicate insights clearly and compellingly.
Image Processing with OpenCV and Python
Learn image processing in Python using matplotlib and OpenCV. Covers reading, manipulating, and saving images, with practical examples for computer vision and data science applications.
Complete Data Science Project
Explore Wordle tweet data through comprehensive EDA using Python, pandas, and matplotlib. Learn data wrangling, visualization techniques, and gain insights from a Kaggle Grandmaster's analysis.
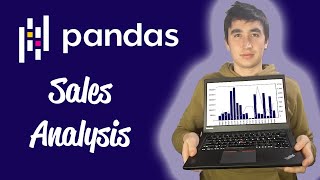
Solving Real World Data Science Tasks With Python Pandas
Analyze real-world sales data using Python Pandas and Matplotlib. Learn data cleaning, exploration, and visualization techniques to answer key business questions and gain valuable insights.
How You Can Build Your Own Worldwide Wildfire Data Collection and Host on Kaggle
Learn to collect, process, and visualize global wildfire data using NASA sources, data engineering techniques, and tools like Kepler.gl, mapboxgl, and Streamlit for insightful analysis and presentation.
Portable and Scalable Data Visualization Techniques for Apache Spark and Python Notebooks
Explore portable and scalable data visualization techniques for Apache Spark and Python notebooks, covering strategies, packages, headless rendering, animations, and big data integration.
Time Series Analysis Visualizations with Matplotlib, Seaborn, and Plotly
Explore time series visualization techniques using Matplotlib, Seaborn, and Plotly. Learn to style charts and analyze trends, seasonality, and moving averages in data science applications.
Getting Started with Technical Analysis Using Python
Learn Python-based technical analysis for stock market predictions, covering data retrieval, calculations, and visualization using libraries like Pandas and Plotly. Ideal for beginners in financial data science.
Linear Regressions with StatsModels - Data Science Tutorial
Learn to create linear regressions using StatsModels, exploring datasets and examples with NumPy, Pandas, Matplotlib, and Seaborn. Analyze professor ratings and tipping strategies through practical applications.
Python for Data Science - Data Science Tutorial - Python Tutorial
Learn Python for data science: versatile programming, complex problem-solving, and real-world applications. Covers key concepts, tools, and techniques with hands-on examples and expert guidance.
Analyzing Twitter Accounts with Python and Personality Insights
Learn to analyze Twitter accounts using Python, Tweepy, and Watson Personality Insights. Create visualizations with Seaborn and Matplotlib to profile Twitter users and gain insights into their personalities.
Data Science: The Bear Necessities - Exploring Koala Data with Python and Pandas
Explore koala data using Python, Pandas, and Matplotlib to create informative visualizations and gain insights into protecting these endangered Australian icons.

Graphs and Vogue Dance: Using Data Structures to Create Choreographies
Explore how graph data structures can be used to create and visualize Vogue Dance choreographies, combining computer science concepts with artistic expression and LGBTQIA+ culture.

Graphs and Vogue Dance: Using Data Structures to Create Choreographies
Explore how graph data structures can be used to create and visualize Vogue Dance choreographies, combining computer science concepts with artistic expression in this innovative approach to dance composition.