
Multilayer Network Science in Julia with MultilayerGraphs.jl
Explore MultilayerGraphs.jl for advanced network analysis in Julia. Learn to model complex systems with interconnected layers, enhancing your data science toolkit.
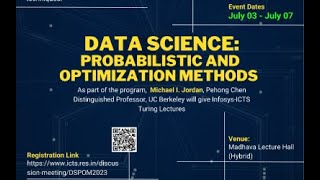
Learning from Dependent Data - Lecture 1
Explore techniques for learning from dependent data, focusing on probabilistic and optimization methods in data science. Gain insights into handling interconnected information effectively.
Tableau Basics Intermediate Tutorial
Comprehensive tutorial on advanced Tableau techniques, covering visualizations, calculations, and table manipulations for effective data analysis and storytelling.
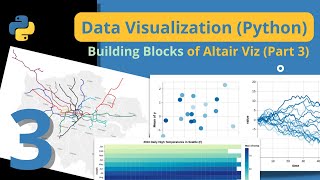
Data Visualization in Python - Altair Data Preparation Techniques
Explore data preparation techniques in Altair for effective visualization, including aggregation, binning, time unit transforms, and filtering to shape and analyze your data effectively.
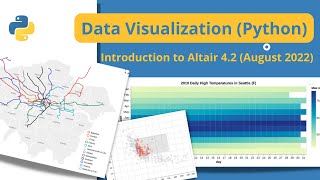
Data Visualization in Python - Altair 4.2 Tutorial
Comprehensive tutorial on Altair for data visualization in Python, covering setup, basic plots, customization, interactivity, and advanced features. Ideal for beginners and intermediate users.
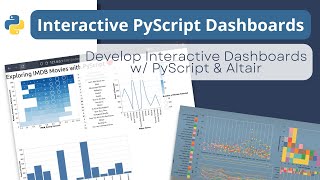
Building an Interactive Dashboard with PyScript and Altair - Tutorial 3
Learn to create an interactive dashboard using PyScript and Altair, from setup to deployment. Covers importing dependencies, building visualizations, and deploying the final product on GitHub Pages.
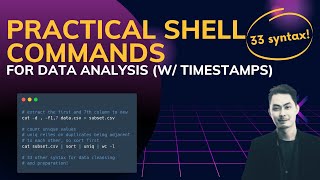
Practical Shell Commands for Data Scientists and Analysts - Command Line Tutorial
Learn essential shell commands for data preparation, cleansing, and analysis. Master practical techniques to enhance your data science workflow and boost productivity using command-line tools.
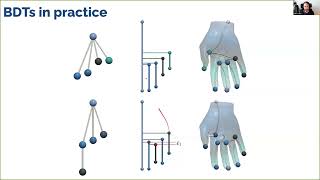
Julien Tierny - Principal Geodesic Analysis of Merge Trees and Persistence Diagrams
Computational framework for Principal Geodesic Analysis of merge trees, adapting PCA to Wasserstein metric space. Efficient algorithm for data reduction and dimensionality reduction in topological data analysis.
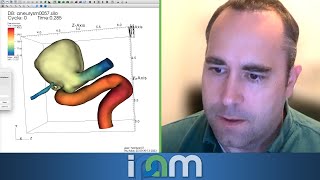
Visualization and Analysis of HPC Simulation Data with VisIt
Explore HPC simulation data visualization using VisIt software, focusing on techniques for analyzing large-scale scientific datasets in high-performance computing environments.
Tableau Basics Advanced Tutorial
Aprenda a criar visualizações avançadas, dashboards interativos e histórias de dados eficazes no Tableau. Domine técnicas de formatação, análise aprofundada e previsão para elevar suas habilidades de análise e visualização de dados.
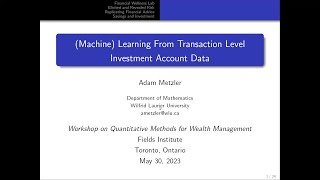
Learning From Transaction-Level Investment Account Data
Explore machine learning techniques for analyzing transaction-level investment data, focusing on practical applications in wealth management and financial decision-making.

Anomaly Detection Tutorials - Machine Learning and Its Types With Implementation
Comprehensive tutorial on anomaly detection techniques in machine learning, covering Isolation Forest, DBSCAN clustering, and Local Outlier Factor with practical implementations and examples.

Tableau Basics Expert Tutorial
Master Tableau essentials: data preparation, advanced visualization techniques, and effective storytelling. Learn to create interactive dashboards, use calculations, and share insights professionally.

Drive a Data Culture with Power BI and Microsoft Teams
Discover how Power BI and Microsoft Teams integrate to enhance data-driven decision-making, enabling easy access to insights, collaborative analysis, and fostering a data-centric culture in connected workplaces.
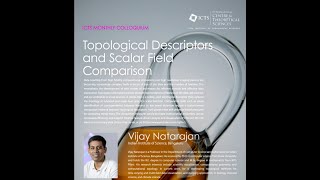
Topological Descriptors and Scalar Field Comparison by Vijay Natarajan
Explore topological descriptors for complex data analysis, focusing on merge trees and tree edit distance-based measures for efficient feature comparison in CFD and 3D cryo electron microscopy.
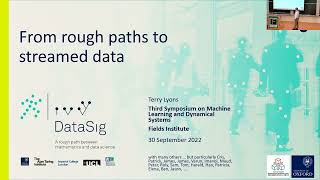
From Rough Paths to Streamed Data
Explore the mathematical connection between rough paths theory and streamed data analysis, bridging theoretical concepts with practical applications in machine learning and dynamical systems.

Fundamentals of DAX in Power BI & Power Pivot
Comprehensive tutorial on DAX fundamentals for Power BI and Power Pivot, covering key concepts, functions, and advanced techniques to enhance data analysis and reporting skills.

Tableau Basics Beginner Tutorial
Comprehensive introduction to Tableau for data analysis and visualization. Learn to create visualizations, work with data sources, build dashboards, and apply advanced techniques for effective data storytelling.
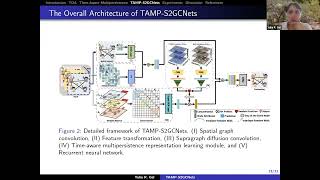
Coupling Time-Aware Multipersistence with Graph CNNs for Time Series Forecasting
Explore innovative time series forecasting using Graph Neural Networks and multipersistence, applied to traffic flow, cryptocurrency prices, and COVID-19 hospitalizations.

Microsoft 365 Productivity Tips and Tricks Tutorial
Boost productivity with advanced Microsoft 365 features: keyboard shortcuts, templates, Outlook tools, macros, and more. Learn time-saving techniques to enhance efficiency in Excel, Word, PowerPoint, and other apps.

Novel Computational Perspectives of Persistence
Explore innovative computational approaches to persistence in algebraic topology, focusing on advanced techniques and their applications in data analysis and topological research.