Главная
Study mode:
on
You
History
Saved
In progress
0 courses
compleat
0 courses
#Art & Design
#Adobe
#ChatGPT
#GitHub
#Plotly
Showing:
35
courses
Sort by Relevancy
Highest rated
Lowest rated
Most recently added
Data Science Dojo
Crash Course in Data Visualization - Tell a Story With Your Data
1
rewiews
Learn effective data visualization techniques to transform insights into impactful stories. Covers chart theory, Python coding with pandas and plotly, and practical tips for creating compelling, interactive visualizations.
Add to list
6
Lesons
1 hour 2 minutes
On-Demand
Free-Video
Data Visualization in Python with Plotly
1
rewiews
Learn to create interactive data visualizations using Plotly in Python, including scatter, bar, line, bubble, histogram, and box plots, with customization techniques for effective data presentation.
Add to list
20
Lesons
1 hour 30 minutes
On-Demand
Free-Video
Plotly Graphs
0
rewiews
Learn to create interactive and visually appealing data visualizations using Plotly in Python, from basic charts to advanced techniques and deployment.
Add to list
16
Lesons
7 hours
On-Demand
Free-Video
Connecting Plotly Graphs to Dash Components
0
rewiews
Learn to create interactive data visualizations by connecting Plotly graphs with Dash components. Master various chart types and enhance user interaction in your Python-based dashboards.
Add to list
11
Lesons
4 hours 30 minutes
On-Demand
Free-Video
Data Visualization Using Plotly for Python
0
rewiews
Learn to create interactive and visually appealing data visualizations using Plotly for Python, covering various chart types and techniques for effective data representation.
Add to list
10
Lesons
1 hour 30 minutes
On-Demand
Free-Video
Data Viz Using Plotly for R
0
rewiews
Learn to create interactive data visualizations with Plotly in R, covering various chart types and customization techniques for effective data presentation.
Add to list
8
Lesons
3 hours 30 minutes
On-Demand
Free-Video
R Tutorials
0
rewiews
Learn essential R skills for data analysis, visualization, and machine learning, covering statistics, deep learning, Plotly, and real-world applications like COVID-19 data extraction.
Add to list
15
Lesons
6 hours
On-Demand
Free-Video
Derek Banas
Plotly Tutorial
0
rewiews
Comprehensive tutorial on Plotly for data visualization, covering various chart types, styling options, and advanced features like 3D plots, maps, and animations.
Add to list
27
Lesons
1 hour 23 minutes
On-Demand
Free-Video
DigitalSreeni
COVID Vaccine Analysis Using Pandas in Python
0
rewiews
Analyze COVID vaccination data using pandas in Python, covering data reading, daily and overall analysis, and visualization with Plotly.
Add to list
8
Lesons
31 minutes
On-Demand
Free-Video
James Briggs
Building a Plotly GME Chart in Python
0
rewiews
Learn to create an interactive stock chart for GameStop using Python, PlotLy, and AlphaVantage API, exploring the coding process from concept to implementation.
Add to list
1
Lesons
1 hour 15 minutes
On-Demand
Free-Video
Prodramp
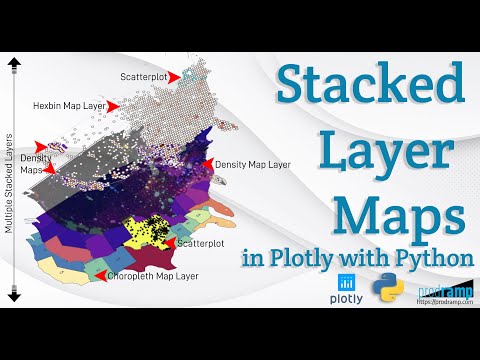
Beautiful and Informative Multilayer Stacked Geo Maps in Plotly With Python
0
rewiews
Learn to create multi-layer stacked geo maps in Plotly with Python, combining hexbin, scatter, and density layers for beautiful and informative geospatial data visualizations and dashboards.
Add to list
16
Lesons
20 minutes
On-Demand
Free-Video
Prodramp
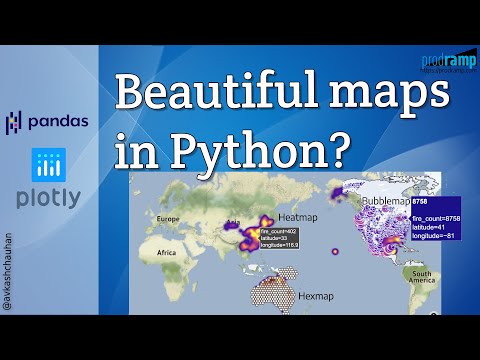
Impactful and Informative Geo Maps With Pandas and Plotly
0
rewiews
Create impactful geo maps using Pandas and Plotly. Learn to visualize large datasets with bubble, heat, and hexagon maps. Hands-on tutorial covers data processing, Plotly integration, and map creation techniques.
Add to list
12
Lesons
15 minutes
On-Demand
Free-Video
Derek Banas
Time Series Analysis Visualizations with Matplotlib, Seaborn, and Plotly
0
rewiews
Explore time series visualization techniques using Matplotlib, Seaborn, and Plotly. Learn to style charts and analyze trends, seasonality, and moving averages in data science applications.
Add to list
7
Lesons
29 minutes
On-Demand
Free-Video
Derek Banas
Python for Data Science - Mastering NumPy, Pandas, and Plotly
0
rewiews
Comprehensive tutorial on using NumPy, Pandas, and Plotly for data science in Python. Covers core concepts and practical applications with hands-on examples and free resources.
Add to list
1
Lesons
1 hour 11 minutes
On-Demand
Free-Video
Derek Banas
Python for Data Science
0
rewiews
Comprehensive guide to mastering Numpy, Pandas, and Plotly for data science in Python. Covers core concepts and practical applications with free, commented code files for hands-on learning.
Add to list
1
Lesons
1 hour 11 minutes
On-Demand
Free-Video
Prodramp
Getting Started with Retail Data Analytics
0
rewiews
Develop retail data analytics skills using Python libraries to create consumer profiles, purchase histories, and interactive dashboards with geo-traceable data from 4500+ Walmart stores.
Add to list
30
Lesons
2 hours 17 minutes
On-Demand
Free-Video
Keith Galli
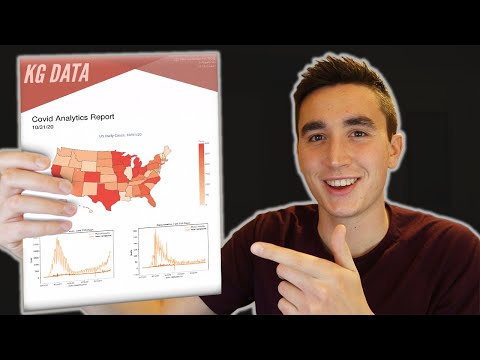
How to Generate an Analytics Report in Python
0
rewiews
Learn to create professional analytics reports in Python using FPDF. Generate visually appealing PDFs with custom layouts, images, and data visualizations from libraries like Matplotlib and Plotly.
Add to list
16
Lesons
49 minutes
On-Demand
Free-Video
Linux Foundation
Creating Quality Control Dashboard Using Python for Manufacturing Issues
0
rewiews
Learn to create interactive quality control dashboards for manufacturing using Python, open-source tools, and data visualization libraries like Plotly and Voila.
Add to list
17
Lesons
23 minutes
On-Demand
Free-Video
NorthSec
Data Science Way to Deal With Advanced Threats
0
rewiews
Explore data science methods for advanced threat detection in SOCs, combining unsupervised and supervised learning to reduce false positives and streamline anomaly triage using ML and interactive visualizations.
Add to list
1
Lesons
28 minutes
On-Demand
Free-Video
EuroPython Conference
Dash - Interactive Data Visualization Web Apps with No Javascript
0
rewiews
Explore interactive data visualization web apps using Dash, a Python framework that eliminates the need for JavaScript. Learn best practices, pitfalls, and when to transition to traditional web development.
Add to list
42
Lesons
32 minutes
On-Demand
Free-Video
PyCon US
Effective Data Visualization
0
rewiews
Learn advanced data visualization techniques using Python libraries to effectively communicate complex data across various fields, from choosing plots to aesthetic decisions.
Add to list
1
Lesons
1 hour 38 minutes
On-Demand
Free-Video
PyCon US
Effective Data Visualization
0
rewiews
Mastering data visualization: from choosing plots to preprocessing datasets. Learn to effectively communicate data using Python libraries like seaborn, matplotlib, and plotly. Covers density estimation, dimensionality reduction, and interactive plotting.
Add to list
19
Lesons
2 hours 23 minutes
On-Demand
Free-Video
EuroPython Conference
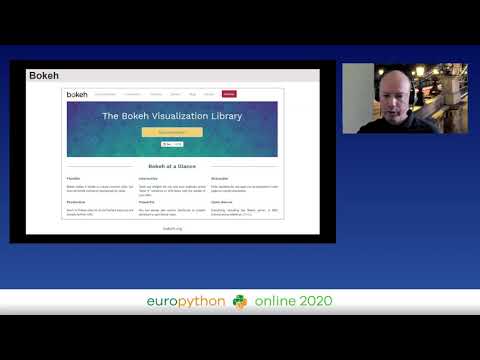
The Python Data Visualization Landscape in 2020
0
rewiews
Explore Python's data visualization libraries including Matplotlib, Plotly, Bokeh, and Altair. Learn about dashboarding solutions like Dash, Panel, and Voila, and understand their key features and recent developments.
Add to list
1
Lesons
31 minutes
On-Demand
Free-Video
EuroPython Conference
Interactive Mapmaking with Python
0
rewiews
Explore interactive mapmaking using Python and GeoDataframes. Learn to create visually appealing maps with libraries like Folium, Kepler.gl, and Plotly, and discover Geopatra for simplified geodata visualization.
Add to list
1
Lesons
31 minutes
On-Demand
Free-Video
EuroPython Conference
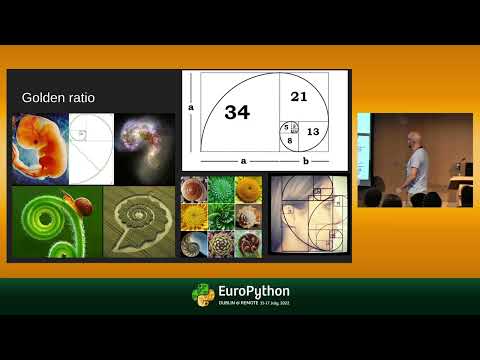
Using Python to Predict Asset Price Reversals
0
rewiews
Learn to predict potential trend reversals in stocks and cryptocurrencies using Python, Pandas, and Plotly. Discover how to identify Fibonacci retracement levels for low-risk trade entries.
Add to list
1
Lesons
33 minutes
On-Demand
Free-Video
Databricks
Power S&P Capital IQ Data Apps with Databricks and Plotly
0
rewiews
Explore S&P Capital IQ Data Apps: Leveraging Databricks and Plotly for powerful analytics, data processing, and interactive visualizations using S&P Global's extensive financial datasets.
Add to list
1
Lesons
29 minutes
On-Demand
Free-Video
PyCon US
Visual Data Storytelling with Blender and Python
0
rewiews
Discover how to create immersive 3D animations for data storytelling by combining Blender's 3D capabilities with Python's 2D plotting libraries, enhancing your data visualization skills.
Add to list
1
Lesons
29 minutes
On-Demand
Free-Video
CodeWithYu
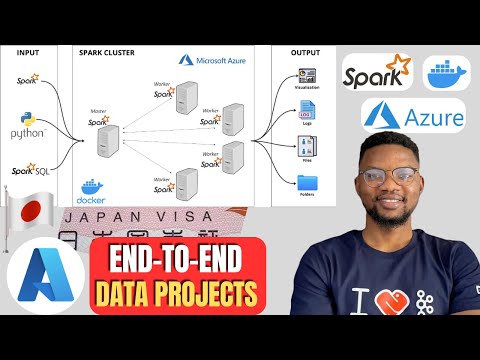
End-to-End Data Engineering on Azure Spark Cluster: Japan Visa Analysis
0
rewiews
Set up Spark master-worker architecture in Docker on Azure, process and visualize Japan visa data using PySpark and Plotly. Clean, transform, and gain insights into visa trends through interactive data analysis.
Add to list
5
Lesons
59 minutes
On-Demand
Free-Video
PyCon US
Making Beautiful, Publication Quality Tables in Python - 2024 Update
0
rewiews
Explore techniques for creating visually appealing, publication-ready tables in Python, bridging the gap between raw DataFrame output and structured, informative displays.
Add to list
1
Lesons
31 minutes
On-Demand
Free-Video
Instituto de Física Interdisciplinar y Sistemas Complejos (IFISC)
Interactive Visualization Dashboards: Transforming Research Papers into Dynamic Web Applications
0
rewiews
Aprende a transformar artículos de investigación en aplicaciones web dinámicas utilizando paneles de visualización interactivos para una presentación más atractiva y accesible de datos científicos.
Add to list
1
Lesons
44 minutes
On-Demand
Free-Video
All Things Open
Reproducible ML Experimentation with Rubicon-ML
0
rewiews
Explore reproducible ML experimentation using rubicon-ml, an open-source Python library for capturing and storing model training information in a searchable way, ensuring full reproducibility and audit-ability.
Add to list
10
Lesons
32 minutes
On-Demand
Free-Video
PyCon US
Visual Data Storytelling with Blender and Python
0
rewiews
Create immersive 3D data visualizations by combining Blender's animation capabilities with Python's 2D plotting libraries for impactful storytelling and enhanced data interpretation.
Add to list
1
Lesons
30 minutes
On-Demand
Free-Video
PyCon US
Making Beautiful, Publication Quality Tables in Python - 2024 Update
0
rewiews
Explore techniques for creating visually appealing, publication-ready tables in Python, bridging the gap between raw DataFrame output and structured, informative displays.
Add to list
1
Lesons
31 minutes
On-Demand
Free-Video
FUN WITH DATA SCIENCE
Plotly Tips - Exploratory Data Analysis
0
rewiews
Explore data visualization techniques using Plotly library for tips dataset analysis. Learn to create various chart types and gain insights through hands-on exploratory data analysis.
Add to list
9
Lesons
1 hour 30 minutes
On-Demand
Free-Video
Great Learning
Essential Python Libraries for Data Science and Development - 2024
0
rewiews
Master essential Python data science libraries including NumPy, Pandas, Matplotlib, Scikit-learn, and more through hands-on examples and practical demonstrations, culminating in building a Tic Tac Toe game.
Add to list
11
Lesons
7 hours 46 minutes
On-Demand
Free-Video
load more...