Description:
Save Big on Coursera Plus. 7,000+ courses at $160 off. Limited Time Only!
Grab it
Explore the process of transforming research papers into dynamic web applications through interactive visualization dashboards in this 44-minute lecture from the Instituto de Física Interdisciplinar y Sistemas Complejos (IFISC). Learn how to create engaging and interactive visual representations of complex scientific data, making research findings more accessible and understandable to a wider audience. Discover techniques for designing user-friendly interfaces, implementing data-driven visualizations, and leveraging web technologies to bring static research papers to life as interactive, exploratory tools.
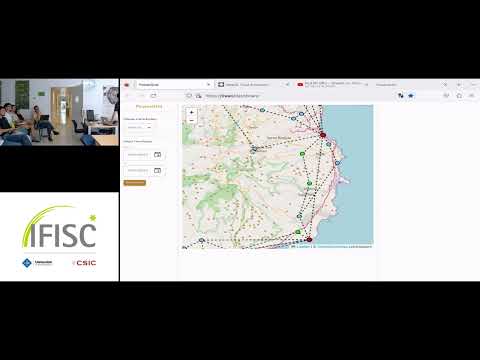
Interactive Visualization Dashboards: Transforming Research Papers into Dynamic Web Applications
Add to list
#Data Science
#Data Visualization
#Data Analysis
#Programming
#Programming Languages
#Python
#Plotly
#Dash