Tableau Data Visualization Advanced Tutorial
Master advanced Tableau techniques: data manipulation, customization, exporting, and interactive visualizations for powerful data storytelling and analysis.

Visualizing Patient Safety - Using Tableau to Analyze Fall Events
Explore Tableau for patient safety analysis, focusing on fall events visualization and data-driven insights in healthcare settings.
Deeper BI Integrations with Databricks SQL
Explore advanced BI integrations for Databricks SQL, including seamless connections with Power BI and Tableau, data model syncing, and updates on drivers and connectors.
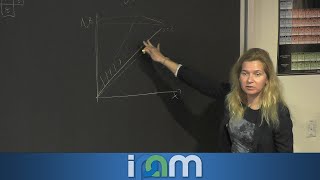
Symmetric Functions: Foundations and Applications in Combinatorics - Part 1
Explore symmetric functions in algebraic combinatorics, representation theory, and statistical mechanics. Learn formulas, combinatorial models, and key properties with applications and open problems.
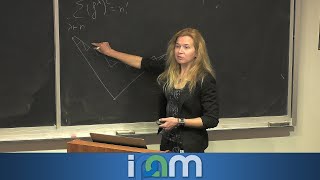
Symmetric Functions: Formulas, Combinatorial Models, and Applications - Part 2
Explore advanced concepts in symmetric functions, their applications in combinatorics and representation theory, and their role in statistical mechanics as partition functions.

Rotation-Invariant Web Bases from Hourglass Plabic Graphs and Symmetrized Six-Vertex Configurations
Explore symmetrized six-vertex model, hourglass plabic graphs, and their applications in statistical mechanics and combinatorics. Discover connections to tableaux, alternating sign matrices, and plane partitions.
ChatGPT Code Interpreter vs Tableau - ChatGPT, Tableau GPT & LLMs
Compara ChatGPT Code Interpreter y Tableau para análisis de datos, explorando capacidades y limitaciones en agregación, visualización y respuesta a preguntas detalladas sobre conjuntos de datos.
Making Informed Decisions
Learn to create effective business analytics dashboards, focusing on data scope, strategic vs operational metrics, and best practices for informed decision-making.
Analytics Spotlight - The New Analyst
Explore evolving analytics trends, skills, and technologies for business analysts. Learn to work with data science, improve data literacy, and embrace ambiguity in modern business intelligence.

The Data Janitor Returns
Practical insights on data-driven decision-making with limited resources. Covers roles, challenges, and real-world solutions in data management, avoiding hype and focusing on impactful strategies.
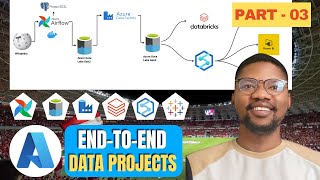
Football Data Analytics with Tableau - Azure Data Engineering Project Part 3
Explore football data engineering: Extract Wikipedia data, store in Azure, migrate with Data Factory, query with Synapse, and visualize in Tableau. Master end-to-end data processes.
A Pragmatic Approach to Turn Your Data into Actionable Insights
Explore BI services like Power BI, QuickSight, and Tableau to create interactive dashboards, embed analytics, and gain actionable insights from your data without custom front-end code.
Data Visualization Excellence: Tableau's Edge with Delta Sharing and Roadmap
Explore Tableau's innovations for Lakehouse analysis, including Delta Sharing connector and AI-driven insights. Learn about secure data visualization and future developments in this expert-led session.

Visualize Data Like a Pro - Learn Tableau for Beginners
Learn to transform raw data into compelling visualizations with Tableau. Master the interface, data types, and dashboard creation for effective data-driven decision-making in just 35 minutes.
Introduction to Tableau Data Visualization
Master data visualization fundamentals with Tableau, learning to create impactful charts, tables, and timelines that transform complex data into clear, actionable business insights.

Football Data Analytics: Azure End-to-End Data Engineering Project
Extract, clean, and analyze football data using Apache Airflow, Azure services, and Tableau. Build a comprehensive data pipeline from Wikipedia to interactive visualizations.
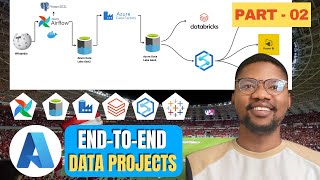
Football Data Analytics: Azure End-to-End Data Engineering Project - Part 2
Extract, store, and analyze football data using Azure services and Apache Airflow. Develop end-to-end data engineering skills through hands-on implementation of a real-world project.