Tableau vs Power BI - Best BI Tool - PowerBi & Tableau Difference
Comparative analysis of Tableau and Power BI, exploring key features, data handling, user experience, and purposes to help professionals choose the best business intelligence tool.
Tableau Basics Full Course Tutorial
Comprehensive Tableau training covering fundamentals to advanced techniques. Learn data visualization, calculations, formatting, storytelling, and sharing insights using Tableau's powerful features.
Tableau Basics Intermediate Tutorial
Comprehensive tutorial on advanced Tableau techniques, covering visualizations, calculations, and table manipulations for effective data analysis and storytelling.
Tableau Basics Advanced Tutorial
Aprenda a criar visualizações avançadas, dashboards interativos e histórias de dados eficazes no Tableau. Domine técnicas de formatação, análise aprofundada e previsão para elevar suas habilidades de análise e visualização de dados.
Tableau Basics Expert Tutorial
Master Tableau essentials: data preparation, advanced visualization techniques, and effective storytelling. Learn to create interactive dashboards, use calculations, and share insights professionally.

Tableau Basics Beginner Tutorial
Comprehensive introduction to Tableau for data analysis and visualization. Learn to create visualizations, work with data sources, build dashboards, and apply advanced techniques for effective data storytelling.
Tableau Data Visualization Expert Tutorial
Master Tableau's data visualization tools: from basics to advanced techniques. Learn to create interactive dashboards, custom reports, and powerful visualizations for effective data analysis and presentation.
Tableau Data Visualization Intermediate Tutorial
Comprehensive guide to intermediate Tableau techniques, covering advanced chart types, map visualizations, and data manipulation for enhanced data analysis and presentation skills.
Tableau Data Visualization Beginner Tutorial
Learn to connect data sources, create various charts, and master essential Tableau features for powerful data visualization and analysis.
Optimize Delivery Experience Using Analytics
Learn to leverage analytics and visualization for data-driven decision-making. Explore essential components, problem-solving techniques, and create powerful Tableau dashboards to optimize delivery experiences.
Tableau Data Visualization Full Course Tutorial
Comprehensive Tableau tutorial covering data visualization techniques, from basic charts to advanced dashboards. Learn to connect data, create various chart types, customize visuals, and share impactful results.
Tableau Data Visualization Master Tutorial
Master Tableau's data visualization tools, from basics to advanced techniques. Learn to create interactive dashboards, custom reports, and effective visualizations for impactful data analysis and presentation.
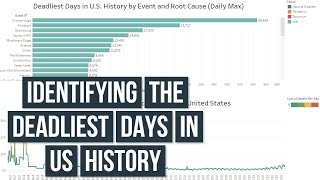
Building a Dataset for the 487 Most Deadly Days in US History
Explore data analysis techniques to identify and visualize the deadliest days in US history, using GitHub datasets and Tableau for impactful visualizations.
Tableau Business Intelligence - Advanced Techniques and Dashboard Creation
Master advanced Tableau techniques for creating insightful dashboards. Learn to analyze world population data, explore USA colleges, and develop powerful visualizations for real-world business scenarios.

Tableau Business Intelligence Expert Tutorial - Advanced Dashboard Techniques
Master Tableau for advanced business intelligence: create interactive dashboards, apply real-world scenarios, and learn expert techniques for insightful data visualization and analysis.
Tableau Data Visualization Professional Tutorial
Comprehensive tutorial on Tableau data visualization, covering dashboard creation, data manipulation, best practices, and sharing techniques for effective and impactful data storytelling.
Tableau Business Intelligence - Beginner Tutorial for Dashboard Creation
Learn to create insightful Tableau dashboards with interactive visualizations, custom reports, and data analysis techniques for real-world business scenarios and effective decision-making.
Tableau Business Intelligence - Intermediate Techniques and Dashboard Design
Elevate your Tableau skills with advanced techniques for creating insightful dashboards. Learn to analyze data, visualize trends, and apply cluster analysis to real-world business scenarios.
Tableau Business Intelligence Master Tutorial - Advanced Dashboard Design and Analytics
Master Tableau for business intelligence: create interactive dashboards, custom reports, and insightful visualizations. Learn best practices, innovative techniques, and real-world applications to elevate your data analysis skills.
Tableau Business Intelligence - Full Course Tutorial
Comprehensive Tableau tutorial covering diverse business scenarios, from personal finance to global data analysis. Learn to create interactive dashboards and gain practical BI skills through hands-on projects.
Tableau Data Visualization Beginner Tutorial
Learn to connect data sources, create various charts, and master essential Tableau features for powerful data visualization and analysis.