Tableau Business Intelligence Master Tutorial - Advanced Dashboard Design and Analytics
Master Tableau for business intelligence: create interactive dashboards, custom reports, and insightful visualizations. Learn best practices, innovative techniques, and real-world applications to elevate your data analysis skills.
Graphs and Descriptive Statistics with R - R Statistical Software Tutorial Videos
Learn to create various graphs and calculate descriptive statistics using R. Master bar charts, boxplots, histograms, scatterplots, and more while customizing plots and adding text and legends.
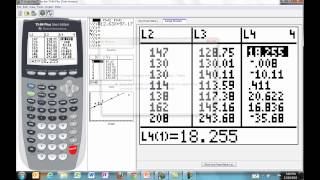
Linear Data Analysis for Math Common Core Standards - Part 3
Explore linear functions for real-world data modeling, focusing on slope and intercept interpretation, linear regression, and residual analysis using interactive tools and practical examples.

Learn Scatter Plots and Best Fitting Lines - Algebra, Statistics and Linear Regression
Master scatter plots and best fitting lines, exploring algebra, statistics, and linear regression concepts for improved data analysis skills.
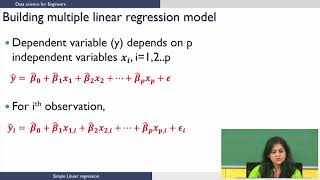
Multiple Linear Regression: Model Building and Selection
Build and select multiple linear regression models through data loading, visualization, and iterative model refinement using R.
Unsupervised Machine Learning - Flat Clustering with KMeans with Scikit-Learn and Python
Explore flat clustering with KMeans using Scikit-learn and Python. Learn to categorize unlabeled data into specified groups through hands-on coding and visualization techniques.
Hyperparameter Tuning Using Tidymodels
Explore hyperparameter tuning for random forest models using global food consumption data, enhancing model performance and gaining insights into international dietary patterns.
ChatGPT Code Interpreter vs Tableau - ChatGPT, Tableau GPT & LLMs
Compara ChatGPT Code Interpreter y Tableau para análisis de datos, explorando capacidades y limitaciones en agregación, visualización y respuesta a preguntas detalladas sobre conjuntos de datos.

Generative Python Transformer Model Released - The Off-Brand Github Copilot
Explore GPyT, an open-source alternative to Github Copilot. Learn how to use this generative Python transformer model for code autocompletion and generation across various programming tasks.

Explorations in Interactive Visual Analytics
Exploración interactiva de análisis visual de big data, abordando desafíos técnicos y humanos para científicos de datos. Presenta técnicas de visualización, principios de diseño y flujos de trabajo para analizar eficazmente grandes volúmenes de informaci…

Election Night Analysis - Art or Science
Explore statistical methods for predicting Australian election results with ABC analyst Antony Green. Learn about data sources, assumptions, and robust processes used to call elections before official counts are finalized.
Tabular Data Visualization Techniques for n-Dimensional Data
Explore techniques for visualizing n-dimensional data, including projection and pairwise methods, to effectively convey complex information in 2D or 3D plots.
Plotly Tips - Exploratory Data Analysis
Explore data visualization techniques using Plotly library for tips dataset analysis. Learn to create various chart types and gain insights through hands-on exploratory data analysis.