Develop Custom Web Dashboards in R with Shiny
Create interactive data visualization dashboards using R's Shiny package. Learn to develop and deploy web-based applications for effective data presentation and analysis.
Getting Started with RStudio
Learn RStudio's key features, from installation to scripting, debugging, and data visualization. Master this powerful IDE for R programming efficiently.
Quick Intro to R
Learn to install and use R programming language, covering basics like data creation, functions, statistics, and visualizations in this quick introduction.
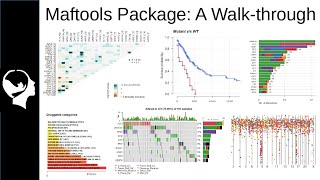
Cancer Somatic Mutation Analysis - MAFTOOLS R Package
Learn to analyze cancer somatic mutations using MAFtools R package. Covers importing data, visualization techniques, driver detection, survival analysis, and comparing cancer cohorts for comprehensive mutation insights.
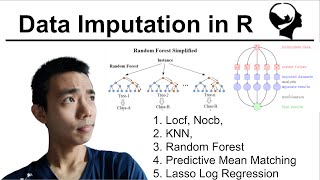
Dealing with Missing Data in R
Learn techniques for handling missing data in R, including various imputation methods, using packages like mice, and evaluating algorithm performance with ggplot2.
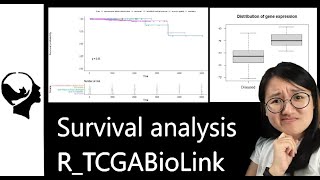
Survival Analysis on Cancer Data - RStudio Tutorial
Aprenda análise de sobrevivência em dados de câncer usando R. Tutorial prático sobre pipeline de análise, uso de dados TCGA, expressão gênica e modelagem preditiva para pesquisa biomédica.

Running Basic Statistical Analysis in R
Learn to perform essential statistical analyses in R, including correlation, linear modeling, t-tests, and heatmaps. Ideal for beginners seeking to leverage R's powerful command-line interface for data analysis.

Google Drive and Google Sheets in R - A RStudio Tutorial
Learn to efficiently use googledrive and googlesheets4 packages in R for seamless data management and analysis with Google Drive and Google Sheets.
How to Use Gganimate in R - A RStudio Tutorial for Beginners
Learn to create dynamic, animated data visualizations in R using gganimate. Master key functions and techniques for enhancing your data storytelling skills.
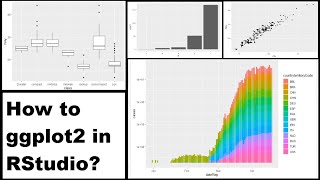
How to Use Ggplot2 in R - A Beginner's RStudio Tutorial
Learn to create data visualizations in R using ggplot2, from basic plots to advanced techniques. Covers installation, data understanding, and various plot types for effective data representation.

Day in the Life of a Data Analyst - SurveyMonkey Data Transformation Using R
Explore data transformation using R for SurveyMonkey data, covering importing, concatenating, melting, joining, and exporting. Learn practical skills for efficient data analysis and manipulation.
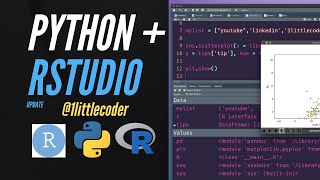
Python on RStudio - Visual Markdown Editor - RStudio Latest Update Demo
Explore RStudio 1.45's new features: visual Markdown editor, command palette, customizable panes, and seamless Python integration for enhanced data analysis and visualization.
Android Smartphone Data Analysis in R
Learn to analyze Android smartphone usage data using R, from downloading Google Takeout data to creating visualizations for app usage comparisons across time periods.

Introduction to R
Learn R programming basics, including its advantages, interface, and essential functions for data analysis and visualization in biology.
Break and Next Statements in R Programming
Learn to control loop execution in R with break and next statements. Understand when and how to use these keywords for efficient programming and flow control in R.
Operators in R Programming - Arithmetic, Logical, Relational, Assignment, Miscellaneous Operators
Comprehensive overview of R programming operators, covering arithmetic, logical, relational, assignment, and miscellaneous types for efficient data manipulation and analysis.
Switch Function in R Programming
Learn to use the switch() function in R for efficient conditional execution, enhancing your programming skills with this powerful control flow tool.
Automated Web Scraping in R Using Rvest
Learn to automate web scraping in R for real-time data analysis. Covers periodic scraping, filtering timely content, text analysis, and setting up hourly email alerts for changing events and trends.
Introduction to Data Visualization with ggplot2
Learn to create powerful data visualizations using R's ggplot2 package. Master customization, choose optimal charts, leverage segmentation, and export high-quality graphics for analysis and presentations.
Feature Engineering - Introduction to Dplyr Part 4
Learn advanced dplyr techniques for feature engineering, including imputing missing values, creating new columns, and combining datasets. Master data manipulation skills to enhance your R programming toolkit.

Intro to Data Visualization with R and ggplot2
Learn to create powerful data visualizations using R and ggplot2. Master customization, choose optimal charts, leverage segmentation, and export high-quality graphics for impactful data analysis and presentation.