MongoDB With Python - Querying JSON Documents - Data Science
Learn to query MongoDB with Python, focusing on JSON documents and data science applications. Covers server connection, insertion, querying, operators, and nested documents.
Deploying Apache Spark Jobs on Kubernetes with Helm and Spark Operator
Learn to deploy Scala Spark jobs on Kubernetes using Helm and Spark Operator. Live coding demo shows scalable, flexible deployments with minimal custom configurations for stress-free implementation.
Koalas - Scaling Pandas API on Apache Spark
Learn to scale pandas operations to big data using Koalas, an open-source project implementing the pandas API on Apache Spark. Transition seamlessly from single-machine to distributed environments for large-scale data science.

Bringing Satellite and Drone Imagery into Data Science Workflows
Explore satellite and drone imagery analysis in data science workflows using RasterFrames, a Spark SQL extension with Python API for processing spatial image data and integrating with ML frameworks.

The Apache Spark File Format Ecosystem - Optimizing Storage for Performance
Explore key file formats in Spark ecosystem: Parquet, ORC, Avro. Learn core concepts, optimization techniques, and how to select the right format for performant data processing and AI/ML workflows.
Time Series Analysis Visualizations with Matplotlib, Seaborn, and Plotly
Explore time series visualization techniques using Matplotlib, Seaborn, and Plotly. Learn to style charts and analyze trends, seasonality, and moving averages in data science applications.
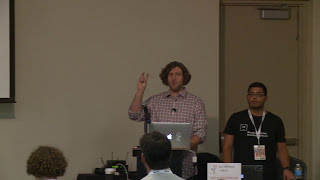
Securing the Spark Fire Hose - 2016
Learn to secure Apache Spark in big data analytics. Explore code and configuration security, data protection strategies, and integration with common technologies to safeguard critical information throughout its lifecycle.
How to Invest with Data Science - Technical Analysis and Portfolio Optimization
Learn data science techniques for investing, covering stock analysis, portfolio optimization, and advanced indicators to make informed investment decisions.
Testing Stock Trading Strategies with Ichimoku Analysis
Learn to test stock trading strategies using Python, focusing on Ichimoku analysis with real-time data, customizable charts, and performance evaluation techniques.
Finding the Best Investments Using Technical Analysis
Learn technical analysis techniques to identify top-performing securities across sectors, create diversified portfolios, and use the Ichimoku Cloud for momentum trading. Includes hands-on Python coding for data analysis and visualization.
Getting Started with Technical Analysis 2 - Bollinger Bands and Advanced Indicators
Learn advanced technical analysis techniques including Bollinger Bands, moving averages, support/resistance lines, and candlestick patterns using Python and data science libraries for stock market analysis.
Getting Started with Technical Analysis Using Python
Learn Python-based technical analysis for stock market predictions, covering data retrieval, calculations, and visualization using libraries like Pandas and Plotly. Ideal for beginners in financial data science.
Technical Analysis: RSI and Bollinger Bands Using Python
Learn to perform technical analysis using Python, focusing on RSI and Bollinger Bands. Create customizable charts with real-time data for stock market predictions using various data science libraries.
Technical Analysis: MACD and Stochastic Oscillator Using Python
Learn to use Python for stock market technical analysis, focusing on MACD and Stochastic Oscillator. Covers data retrieval, chart creation, and multiple technical indicators using various data science libraries.
Technical Analysis with Python for Stock Market Predictions
Learn Python-based technical analysis for stock market predictions, covering data retrieval, chart patterns, moving averages, and advanced visualization techniques using data science libraries.

Python for Data Science - Mastering NumPy, Pandas, and Plotly
Comprehensive tutorial on using NumPy, Pandas, and Plotly for data science in Python. Covers core concepts and practical applications with hands-on examples and free resources.
Investment Analysis: Python for Finance - Part 9
Learn investment analysis using Python: calculate Alpha, Beta, CAPM, expected returns, and Sharpe Ratio. Practical coding examples provided for hands-on experience in financial data analysis and portfolio management.
Investment Portfolio Management with Python - Maximizing Return and Minimizing Risk
Learn to maximize returns and minimize risk using Markowitz Portfolio Optimization and Sharpe Ratio. Master efficient frontier, volatility analysis, and advanced data science techniques for investment portfolio management.
Best Stocks to Buy Now - Python for Finance - Part 6
Learn to automate stock market predictions using Python, focusing on regression analysis to identify high-momentum stocks and forecast potential returns across the entire market.
Stock Market Prediction Using Regression Analysis - Python for Finance
Learn stock market prediction using Python, covering regression analysis, forecasting, and ARIMA models to guide investment decisions based on past performance.
Low Risk Investments - Python for Finance 4
Learn Python techniques for analyzing low-risk investments, including portfolio creation, risk assessment, ROI analysis, and stock sector diversification using data science libraries.