
Power BI Crash Course for Beginners
Learn to import, analyze, and visualize data using Power BI Desktop. Master data cleaning, DAX, Power Query, and create insightful visualizations for effective business intelligence.

Visualizing Data and Building Dashboards in Excel & Power BI
Comprehensive guide to data visualization and dashboard creation in Excel and Power BI, covering various chart types, PivotTables, Power Query, and advanced techniques for effective data presentation.

All Important Excel Lookup Formulas - Excel Worksheet, Power Query & DAX – 28 Examples
Comprehensive guide to Excel lookup formulas, covering XLOOKUP, FILTER, XMATCH, INDEX, and more. Includes examples in Excel, Power Query, and DAX for exact and approximate matches.

Logical Tests - Excel Formulas, Conditional Formatting, PivotTables, Power Query, and More
Master Excel's logical functions, formulas, and advanced features. Learn to create powerful data analysis tools using PivotTables, conditional formatting, and Power Query for efficient data management.

Intermediate Microsoft Excel Tutorial - How to Use Power Query
Learn Power Query in Excel: Import, transform, and consolidate data efficiently. Master data cleaning, column manipulation, merging tables, and formula creation for streamlined data management.
Microsoft Power BI Beginner to Intermediate Course - Data Visualization Training
Comprehensive training on Power BI covering data import, query manipulation, visualization creation, and report design. Learn to create interactive dashboards and gain practical skills in business intelligence.
Power Query Group By - Complete Lesson with 10 Examples
Comprehensive tutorial on Power Query's Group By feature, covering basic to advanced applications with 10 practical examples for data analysis and calculations in Excel.

Microsoft Power BI Desktop for Beginners - 4-Step Tutorial
Comprehensive tutorial guiding beginners through Power BI Desktop, from installation to publishing. Learn data import, transformation, integration, and visualization techniques to create insightful dashboards.
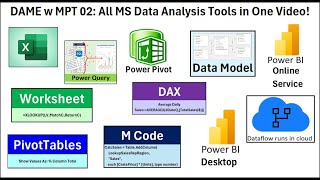
Microsoft Data Analysis Tools: Excel, Power Query, Power BI, Dataflow, DAX and M Code
Comprehensive tutorial on Microsoft data analysis tools, covering Excel, Power Query, Power BI, and more. Learn formulas, data modeling, and visualization techniques for effective data analysis.
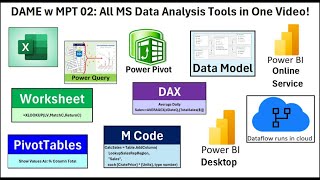
Microsoft Data Analysis Tools: Excel, Power Query, Power BI, Dataflow, DAX, and M Code
Comprehensive tutorial on Microsoft data analysis tools, covering Excel, Power Query, Power BI, and more. Learn to import, transform, and visualize data using various techniques and formulas.

Power Query in 20 Minutes - How it Works
Explore Power Query's internals and gain a deeper understanding of this increasingly prevalent tool in Power BI and Fabric technologies.
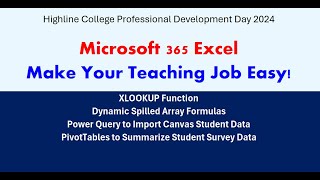
Excel 365 for Teaching: Dynamic Arrays, XLOOKUP, Power Query and PivotTables
Streamline teaching tasks with Excel 365: master dynamic arrays, XLOOKUP, Power Query, and PivotTables for efficient gradebooks, budgets, and data analysis.
Query Folding in Power Query: Importance for Performance
Discover query folding's importance for Power Query performance and learn factors that can hinder its effectiveness.

Advanced Excel 365 Training: Dynamic Arrays, Complex Lookups, and Power Tools
Boost data analysis skills with advanced Excel 365 features. Master dynamic arrays, complex lookups, custom functions, Power Pivot, and Power Query for efficient data manipulation and management.

Business Analytics Marathon - Tools for Exploratory Data Analysis
Explore essential tools for data analysis, including Power Query and Pivot Tables, with practical demos and insights into machine learning applications.
Create Amazing 3D Topographic Maps in Excel
Create stunning 3D topographic maps in Excel using Power Query and 3D Maps. Learn practical applications and advanced techniques for data visualization and analysis.
Text Analytics API with Cognitive Services - Achieving AI Analytics
Learn to analyze feedback using Azure Cognitive Services, transforming data from Dynamics 365 to create insightful models and gain valuable AI-driven analytics insights.
Power Query and Power BI - Analytics
Explore Facebook data analysis using Power Query and Power BI. Learn to extract insights from your feed trends and photo locations for personalized self-service business intelligence.

Power Query: il tesoro nascosto dentro Power BI
Scopri le potenzialità di Power Query per la trasformazione dei dati in Power BI, inclusi i fondamenti del linguaggio M e le migliori pratiche per ottimizzare il suo utilizzo.
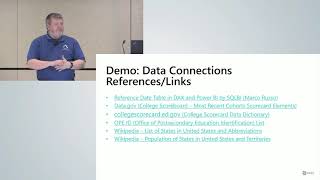
Data Modeling and Prototyping in Power BI Desktop
Explore rapid data modeling and prototyping using Power BI Desktop. Learn to connect, cleanse, and model data from various sources, creating quick reports for project approval without licensing costs.

ETLs with PowerBI and Introduction to Power Query
Aprende a realizar ETLs eficientes y domina Power Query en PowerBI para transformar y cargar datos de manera efectiva, mejorando tus habilidades de análisis y visualización.