
Excel Introduction to Data Analysis Tutorial
Learn essential Excel data analysis techniques: formatting, conditional functions, charting, and Pivot Tables. Gain skills to summarize, visualize, and extract insights from your data effectively.

Kung Fu Data Wrangling in Python with Pandas
Learn essential Pandas techniques for efficient data manipulation in Python, covering dataframes, filtering, indexing, grouping, joining, and handling missing values with practical examples.
Azure Databricks SQL Introduction and Deep Dive
Explore Azure Databricks SQL in notebooks, covering syntax, widgets, databases, and advanced techniques for efficient data manipulation and analysis.

Business Analytics Marathon - Tools for Exploratory Data Analysis
Explore essential tools for data analysis, including Power Query and Pivot Tables, with practical demos and insights into machine learning applications.
DAX Formulas in Action
Explore DAX formulas for BI solutions in Excel and SQL Server. Learn to create calculated columns, measures, and effective PivotTable analysis through hands-on demonstrations.
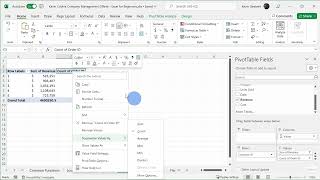
Excel Pivot Tables Tutorial - Lesson 9-1
Master pivot tables in Excel through hands-on demonstrations and practical techniques for analyzing, summarizing, and presenting complex data effectively.

How to Create Pivot Tables from Multiple Excel Worksheets
Master the process of combining and analyzing data from multiple Excel sheets using Power Query and pivot tables to create powerful data summaries and insights.

Microsoft Excel Fundamentals - From Basics to Pivot Tables
Master essential Excel skills from basic data entry to advanced features like pivot tables, formulas, and collaborative tools for improved data analysis and spreadsheet management.
Creating and Customizing Pivot Charts in Excel - From Data Preparation to Advanced Filtering
Master the creation and customization of pivot charts in Excel to transform complex data into dynamic visualizations. Learn data formatting, chart manipulation, and filtering techniques for effective data analysis.
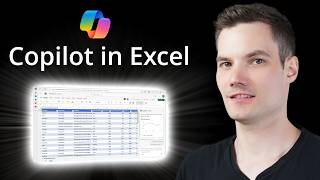
Microsoft Excel Copilot - Features, Capabilities, and Analysis
Explore how Copilot enhances Excel workflows through AI-powered data analysis, formula generation, and visualization tools, evaluating its practical benefits and limitations.

Google Sheets - From Basics to Advanced Features Tutorial
Master spreadsheet essentials with hands-on practice in data entry, formulas, charts, pivot tables, and collaboration features. Transform raw data into meaningful insights using practical functions and visualization tools.

How to Create Impactful Dashboards in Excel for Business Analytics
Learn to create dynamic Excel dashboards using pivot tables, charts, and advanced features. Master data cleaning, visualization, and analysis techniques for impactful business insights.

Google Sheets Tutorial - How to Use Google Sheets
Master Google Sheets essentials: data manipulation, formulas, formatting, pivot tables, and VLOOKUP. Learn to create insightful charts and leverage ChatGPT for enhanced productivity and data analysis.
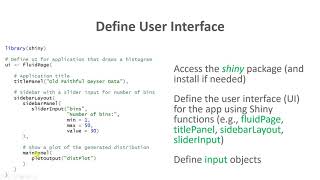
Data Visualization
Learn to create interactive web apps, tables, and various charts in R and Excel for effective data visualization and analysis.

Advanced Excel Techniques for HR Data Management and Analysis
Master advanced Excel techniques for HR data management, from pivot tables and conditional formatting to data validation and interactive reporting - all designed to streamline HR analytics and decision-making processes.
Microsoft Excel Express Tutorial for Beginners - From Basics to Advanced Features
Master essential Excel skills from navigation and data entry to PivotTables and advanced functions in a fast-paced, practical tutorial designed for immediate productivity gains.